Crustal and Subduction Zone Processes in Western Washington
and Background for Episodic Tremor
Dal Stanley (1) and Antonio Villasenor(2)
(1)USGS retired, Enumclaw WA, (2)Institute of Earth Sciences CSIC, Barcelona
Abstract
We present a new synthesis of key geophysical and tectonic data that aid in mapping the Cascadia margin of Western Washington to provide details of subduction, accretion, and recently observed 'episodic tremor'. In particular, aeromagnetic data are combined with previous seismic tomography to provide a detailed view of upper crustal and lower crustal features directly above the downgoing Juan de Fuca plate. The nature of the Seattle fault zone in relation to a northward moving mafic crustal block and interaction of this block with the downgoing Juan de Fuca plate is discussed to explain seismicity patterns and a complex 'transfer zone' as noted by Lamb et al. (2011). A characteristic tremor pattern has often initiated near this transfer zone to expand into a regional tremor event. We interpret that this characteristic tremor pattern reflects the unstable contact of the mafic block south of the Seattle fault with the subducting Juan de Fuca plate and the repeatable tremor pattern could be envisioned as a possible earthquake warning indicator. The tremor pattern from this key area and then surrounding the Olympic Peninsula geologic complex reveals that the tremor follows mapped tectonic details.And although there appears to be some triggering relationship to tidal forces, the very clear feature in the episodes is the role of the transfer zone at the west end of the Seattle fault. In addition to the geophysical details that define the Seattle fault zone block and the gap between this block and features in the deep crust to the north, we have found that that a significant multi-fault junction occurs on the east side of the Puget Lowland. In this junction the east end of the Seattle fault come close to intersecting the SE end of the South Whidbey Island fault, the Darrington-Devils Mountain fault, and the Rattlesnake Mountain fault. In addition the aeromagnetic data are used to define a feature that we call the Yakima Fold Boundary. This feature traverses the Columbia Plateau in a well defined, curving lineament that expresses what we interpret as the accretionary boundary between Cretaceous and older terranes and Tertiary terranes under the main part of the Plateau.
Introduction
The northern Cascadia subduction zone along Oregon, Washington, and Vancouver Island (Figure 1a) has been hypothesized as the potential location for a large megathrust earthquake. Evidence for past great earthquakes on the subduction zone is extensive (Atwater et al., 1995) and includes signs of land-level changes, tsunamis (Satake et al., 1996), and liquefaction. In addition, geodetic (Mitchell et al., 1994), GPS, and strain (Savage et al., 1991) data provide evidence for recent stress buildup in the subduction zone. Radiocarbon and tree-ring dating of drowned forests, assumed to be associated with major subduction zone earthquakes, show that the most recent large such event occurred about 1700 AD (Atwater et al., 1995). Although it is generally accepted that convergence between the Juan de Fuca plate (JDFP) and North American plate (NAP) occurs at a rate of about 30-46 mm/yr (Wilson, 1993), there is considerable uncertainty pertaining to the along strike seismic behavior of the megathrust and possible length and location of segments which might generate large earthquakes. Besides convergence rate, many other factors influence the location of source regions and moment release in great subduction zone earthquakes. One of the key variables in subduction zone behavior is the nature of the overlying continental plate along strike and the resulting variable stress reflected in the subduction interface.
Frictional states along strike and downdip within the subduction thrust zone are key parameters required for quantification of seismic source regions. Frictional states are related to thrust zone temperatures that are unknown in the deeper parts of the subduction interface, but are also dependent upon deep fluid flow and nature of minerals in the thrust. Subducted sediments may lubricate the thrust zone downdip from the accretionary prism, but there is little agreement on the actual amount of deeply subducted sediments and no accurate constraints on their pore-pressures or metamorphic grade, factors that determine seismic strength of the interface. Onshore uplift data has been interpreted to represent elastic deformation due to offshore subduction thrust coupling. However, without knowledge of offshore vertical motions, modeling of subduction zone dynamics from onshore uplift data alone is somewhat qualitative. Geodetic data from recent GPS comprehensive surveys under the PANGA group confirm that active strain is occurring in the northeast subduction convergence direction and being periodically released in a periodic manner every 12-14 months. This backslip monitored by the GPS instruments is also accompanied by episodic tremor events that migrate along the margin in a complex but diagnostic manner. In this report we update knowledge of this dynamic behavior, but first start with new details of the continental crust which reflect both accretionary history and dynamics of the subduction geometry. Earlier earthquake tomographic models in Stanley et al. (1999) provide a framework for understanding many of the necessary details of the subduction zone and overlying crustal units in western Washington where we focus this report. In addition data from the National Magnetic Database provide an extremely useful complement to this tomography imaging. The two data sets and other studies constitute an excellent framework for better understanding of the remarkable episodic tremor recordings.
GEOLOGIC AND SEISMICITY BACKGROUND
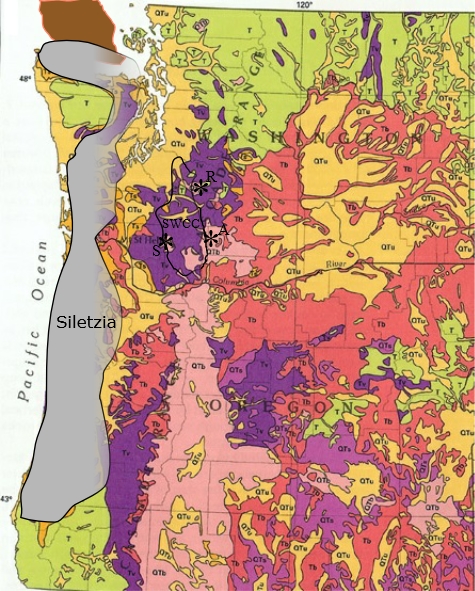
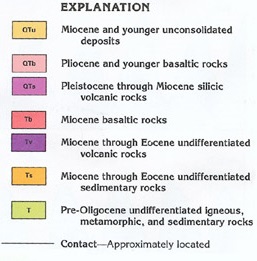
Figure 1a--Geologic map of Washington and Oregon from USGS Publication 12-99 available online. Modified to show the location of the Siletzia mafic complex and the SWCC conductor between the three southern Washington Cascades volcanoes, Rainier (R), Adams (A), and Mt. St. Helens (S).
The geologic map of Fig. 1a outlines the volcanic terranes associated with the Tertiary and Quaternary Cascades volcanic arc, along with key elements of the coast range region. The gray coastal pattern outlines the accreted mafic complex called Siletzia, which forms a massive core along the coast in western Oregon, but tails off into pieces by the latitude of the Olympic Mts. The Olympic complex (green) consist largely of Pre-Oligocene sedimentary rocks imbricated in steep slices wrapped around inside the rim of Siletzia units which they underthrust at the contact zone.
The geologic map of Fig. 1a outlines the volcanic terranes associated with the Tertiary and Quaternary Cascades volcanic arc, along with key elements of the coast range region. The gray coastal pattern outlines the accreted mafic complex called Siletzia, which forms a massive core along the coast in western Oregon, but tails off into pieces by the latitude of the Olympic Mts. The Olympic complex (green) consist largely of Pre-Oligocene sedimentary rocks imbricated in steep slices wrapped around inside the rim of Siletzia units which they underthrust at the contact zone.
Figure 1b--Detailed geology of the Puget Lowland region from the Washington Deptment of Natural Resources excellent web site. SWIF=South Whidbey Island fault, DDMF=Darrington Devils Mt. fault zone, SFZ=Seattle fault zone, TFZ=Tacoma fault zone, KA=Kingston arch, RMFZ=Rattlesnake Mt. fault zone, YFB=Yakima fold boundary (as defined in this report). Earthquakes include relocated and former locations of relocated with depth legend to the right.
The geologic map and seismicity plot shown above adapted from the DNR (Dept. of Natural Resources, WA) web site shows the character of key seismicity patterns discussed below. These patterns are related to mapped faults such as the RMFZ, TFZ, SFZ, SWIF, and DDMF. The location and nature of these faults, as well as our interpreted lineament of the Yakima fold boundary (YFB) become more evident with the aid of aeromagnetic and seismic tomography results. One feature is worth noting at this point, however. The relatively well defined line of earthquakes south of the SWIF is along a deep mafic block boundary on the north side of the Kingston Arch. This deep block boundary was defined in relocated earthquakes and south dipping higher mafic velocities near the Kingston Arch trend in the tomographic sections of Stanley et al. (1999) and ilustrated below in Fig. 6 in a later discussion.
The geologic map and seismicity plot shown above adapted from the DNR (Dept. of Natural Resources, WA) web site shows the character of key seismicity patterns discussed below. These patterns are related to mapped faults such as the RMFZ, TFZ, SFZ, SWIF, and DDMF. The location and nature of these faults, as well as our interpreted lineament of the Yakima fold boundary (YFB) become more evident with the aid of aeromagnetic and seismic tomography results. One feature is worth noting at this point, however. The relatively well defined line of earthquakes south of the SWIF is along a deep mafic block boundary on the north side of the Kingston Arch. This deep block boundary was defined in relocated earthquakes and south dipping higher mafic velocities near the Kingston Arch trend in the tomographic sections of Stanley et al. (1999) and ilustrated below in Fig. 6 in a later discussion.
Figure 1c--Combined magnetic and gravity map of Washington and northern Oregon with southern Vancouver Island from Finn et al. (1998). Major fault zones are noted by white lettering and the Olympic Wallowa Lineament from Raisz (1945) also indicated but refuted in this publication. SJF=San Juan Island fault, LRT=Leech River thrust, DMF=Devils Mt fault (DDMF elsewhere in this report), OLMT=Olympic Mt terrane, WRZ=western Rainier zone, SHZ=St. Helens zone, EB=Everett Basin, SB=Seattle Basin, TB=Tacoma Basin, PHFZ=Portland Hills fault zone, DAR=Darrington fault.
Gravity and magnetic data have been very useful in understanding the tectonic/geologic setting of the Cascadia subduction zone and complexity of the continental crust along the Pacific Northwest margin. The figure above from Finn et al. (1998) shows gravity and magnetic lows associated with the Seattle, Tacoma, Everett, and Bellingham basins. Most striking, however, are the highs in gravity and magnetic fields connected with dense, iron-rich mafic rocks in the Oregon Coast Range that form a continuous upper crust made up primarily of the Crescent Formation. The Crescent and Siletz River mafic rocks form an accreted spreading complex that is generally called Siletzia (Stanley et al., 1999). These mafic rocks are seen to wrap around the Olympic Mts complex which is made up of highly imbricated Tertiary sedimentary rocks. The ‘OWL” shown on this figure is viewed with skepticism in our recent studies and we have found a more fundamental structure to be outlined below after inspection of more recent and broad magnetic data in the National Magnetic Map.
Gravity and magnetic data have been very useful in understanding the tectonic/geologic setting of the Cascadia subduction zone and complexity of the continental crust along the Pacific Northwest margin. The figure above from Finn et al. (1998) shows gravity and magnetic lows associated with the Seattle, Tacoma, Everett, and Bellingham basins. Most striking, however, are the highs in gravity and magnetic fields connected with dense, iron-rich mafic rocks in the Oregon Coast Range that form a continuous upper crust made up primarily of the Crescent Formation. The Crescent and Siletz River mafic rocks form an accreted spreading complex that is generally called Siletzia (Stanley et al., 1999). These mafic rocks are seen to wrap around the Olympic Mts complex which is made up of highly imbricated Tertiary sedimentary rocks. The ‘OWL” shown on this figure is viewed with skepticism in our recent studies and we have found a more fundamental structure to be outlined below after inspection of more recent and broad magnetic data in the National Magnetic Map.
Figure 2--Interpretation of block motions for the JDFP and continental geologic units by Wells et al. (2008). Our interpreted Yakima fold boundary has been added (YFB) as the location of stress at the pre-Tertiary accretionary boundary (tan units) defined in magnetic data in Fig. 7 below.
Before discussing details of geology, stress relief, and broad tectonics, it is worth looking at a figure from Wells et al. (1998) in Fig. 2 that portrays his interpretation of motion of crustal blocks overlying the underlying subducting JDFP. The northwestern translation and clockwise rotation of coastal Oregon units has been partially verified by GPS measurements, but the details of north south motion of Oregon and Washington coastal blocks has been refined through not only GPS measurements but by distinctive earthquake patterns and recently episodic tremor associated with measured slip. The important Yakima fold boundary truncates a set of compressional features oriented largely east-west due to north-south compression of Columbia Plateau basaltic terrains (Tertiary) and which Wells identifies as the Yakima fold and thrust belt.
Before discussing details of geology, stress relief, and broad tectonics, it is worth looking at a figure from Wells et al. (1998) in Fig. 2 that portrays his interpretation of motion of crustal blocks overlying the underlying subducting JDFP. The northwestern translation and clockwise rotation of coastal Oregon units has been partially verified by GPS measurements, but the details of north south motion of Oregon and Washington coastal blocks has been refined through not only GPS measurements but by distinctive earthquake patterns and recently episodic tremor associated with measured slip. The important Yakima fold boundary truncates a set of compressional features oriented largely east-west due to north-south compression of Columbia Plateau basaltic terrains (Tertiary) and which Wells identifies as the Yakima fold and thrust belt.
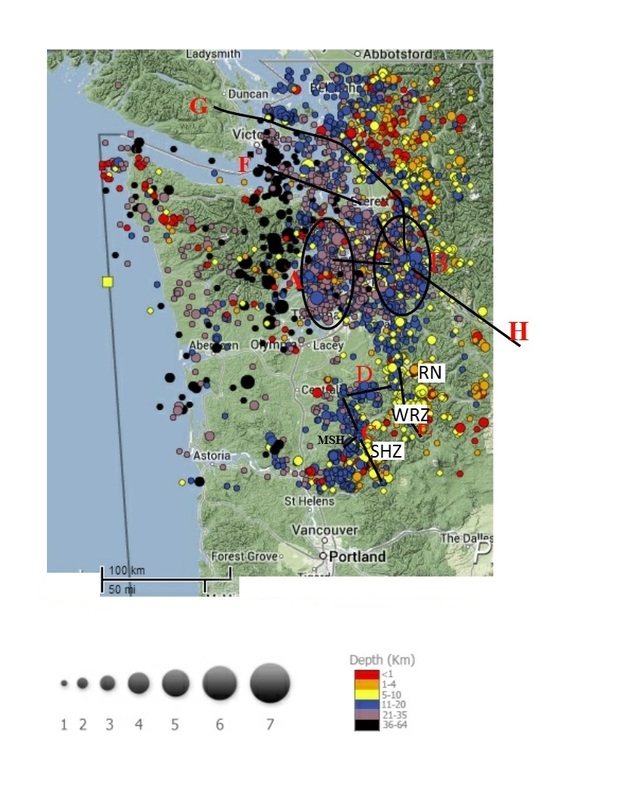
Figure 3--Earthquakes for the period 2000-present from the ANSS data base. SHZ=St. Helens zone, WRZ=western Rainier zone, RN=Mt. Rainier, D=stepover zone, H=YFB, G=DDMF (Darrington Devils Mt. fault, F=SWIF=south Whidbey Island fault. Ellipses A and B are seismicity concentrations discussed in text.
In Fig. 3 the earthquake patterns of significance to our tectonic discussion are denoted in key cases by lettered lines and ellipses. This view of the seismicity is broader than that of Fig. 1b which was focused on the Puget Lowland area alone. Area 'A', as shown on the cross-section in Fig. 4 below contains events associated with the Siletzia rocks in the two blocks just north and south of the Seattle fault and forming the boundary of the Seattle Basin. Area B is in the area of conjunction of the DDMF (G), the SWIF (F), the RMFZ, and the YFB (H) where non mafic units in migrating pieces of allocthonous or autocthonous crust become stacked against the nose and curving boundary of pre-Tertiary North Cascades crust. These events extend from the surface down to the base of this stacked crust. The DDMF is the locus of a definitive trend of events in the area north of the conjunction area. In the Cascades, D is the stepover zone between the north end of the SHZ and WRZ. Seismicity in the WRZ west of Mt. Rainier (RN) extends in a NS dextral slip zone up into the region of seismicity in area B.
In Fig. 3 the earthquake patterns of significance to our tectonic discussion are denoted in key cases by lettered lines and ellipses. This view of the seismicity is broader than that of Fig. 1b which was focused on the Puget Lowland area alone. Area 'A', as shown on the cross-section in Fig. 4 below contains events associated with the Siletzia rocks in the two blocks just north and south of the Seattle fault and forming the boundary of the Seattle Basin. Area B is in the area of conjunction of the DDMF (G), the SWIF (F), the RMFZ, and the YFB (H) where non mafic units in migrating pieces of allocthonous or autocthonous crust become stacked against the nose and curving boundary of pre-Tertiary North Cascades crust. These events extend from the surface down to the base of this stacked crust. The DDMF is the locus of a definitive trend of events in the area north of the conjunction area. In the Cascades, D is the stepover zone between the north end of the SHZ and WRZ. Seismicity in the WRZ west of Mt. Rainier (RN) extends in a NS dextral slip zone up into the region of seismicity in area B.
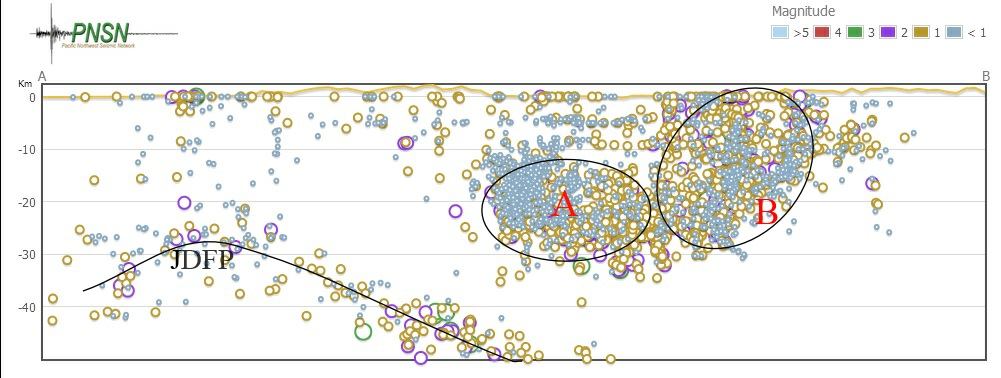
Figure 4--Cross-section of events in Fig. 3 through the Seattle area and eastward to the Tertiary Cascades terrain.
The character of seismicity in the Puget Lowland basin was discussed in Stanley et al. (1999) in detail and the seismicity data base was used to calculate a tomographic velocity model of western Washington and a coarser grid was employed to extend the model to the Columbia Plateau region. This tomography was very successful in mapping key details of the geometry of the subducting JDFP and overlying crustal features. One of the key findings of the tomographic study was defining the shape of the JDFP arch underlying the Olympic Mts. Figure 5 below illustrates key details through an overhead view utilizing 'streamlines' to define shape details. In addition to the obvious planar shape to the top of the NE trending arch axis, a side 'fold' is defined between two high velocity Siletzia units on either side of a 'gap' in these mafic rocks. The Seattle Basin is controlled by this gap and the Seattle fault occurs on the south side of the gap at the northern boundary of the mafic block just south of Seattle.
TOMOGRAPHY RESULTS AND DEEP STRUCTURAL SETTING
The results from multiscale tomographic studies using the seismicity data base available from the Pacific Northwest Seismic Network (PNSN) at University of Washington have been extremely valuable to understanding the deep and intermediate depth structures of the Puget Lowland region and Olympic Peninsula as discussed in depth by Stanley and others (1999). Other geographically focused tomographic investigations have been done in the region but none has had the coverage or many of the details in the subject study. An example is the study of Ramachandran et al. (2006).
Figure 5--Surface constructed from the 7.5 km/s values from tomographic models derived by Antonio Villasenor in Stanley et al. (1999) with streamlines shown in red. Arrows reflect two components to JDFP arch geometry. SFZ=Seattle fault zone. Circles near Olympia denote four significant earthquake locations which occurred within the JDFP.
A good example of the information available from the earlier tomographic study is the geometry of the JDFP arch area from Olympia to Vancouver Island mapped in the isovelocity image of Fig. 5. The nature of the arch signifies the result of both north south compression and NE directed thrusting of the JDFP under the region. The geometry of the arch is well illustrated by the red 'streamlines' which define the directions that water would flow on the isovelocity surface. The streamlines show that the north side of the arch is deformed by a mafic complex on the south end of Vancouver Island and forms the tectonic rim of the Olympic complex. This feature is indicated in the model constructed from tomography in Fig. 6b below. The significant deep 'gap' in mafic blocks around the nose of the arch is shown on both Fig. 6a and 6b. and in the regional tomography image of Fig. 6c. The black arrows shown in Fig. 5 indicate two critical components of JDFP motion in the area of the arch. The northern arrow is evident in the streamline delineation of arch motion and primary fold axis. The southern arrow is keyed to the 'sidestream' of subduction direction that trends into the 'gap' under the Seattle basin.
A good example of the information available from the earlier tomographic study is the geometry of the JDFP arch area from Olympia to Vancouver Island mapped in the isovelocity image of Fig. 5. The nature of the arch signifies the result of both north south compression and NE directed thrusting of the JDFP under the region. The geometry of the arch is well illustrated by the red 'streamlines' which define the directions that water would flow on the isovelocity surface. The streamlines show that the north side of the arch is deformed by a mafic complex on the south end of Vancouver Island and forms the tectonic rim of the Olympic complex. This feature is indicated in the model constructed from tomography in Fig. 6b below. The significant deep 'gap' in mafic blocks around the nose of the arch is shown on both Fig. 6a and 6b. and in the regional tomography image of Fig. 6c. The black arrows shown in Fig. 5 indicate two critical components of JDFP motion in the area of the arch. The northern arrow is evident in the streamline delineation of arch motion and primary fold axis. The southern arrow is keyed to the 'sidestream' of subduction direction that trends into the 'gap' under the Seattle basin.
Figure 6a--East west slice through earthquake tomographic model through the gap between mafic blocks north and south of the Seattle Basin. Gray velocity isosurface is the same as in Fig. 5 of 7.5 km/s.
The clarity of the JDFP image and surrounding mafic blocks riding on top of the arch are well illustrated in Fig. 6a. Olympic core rocks (velocities in blue and yellow, 4.75-6.5 km/s) are being thrust into the gap between two mafic blocks, the southern one on the south side of the Seattle fault zone and the northern one just north of the Seattle basin in the Kingston arch area. The Seattle basin is in fact formed by the gap in these two mafic blocks.
The clarity of the JDFP image and surrounding mafic blocks riding on top of the arch are well illustrated in Fig. 6a. Olympic core rocks (velocities in blue and yellow, 4.75-6.5 km/s) are being thrust into the gap between two mafic blocks, the southern one on the south side of the Seattle fault zone and the northern one just north of the Seattle basin in the Kingston arch area. The Seattle basin is in fact formed by the gap in these two mafic blocks.
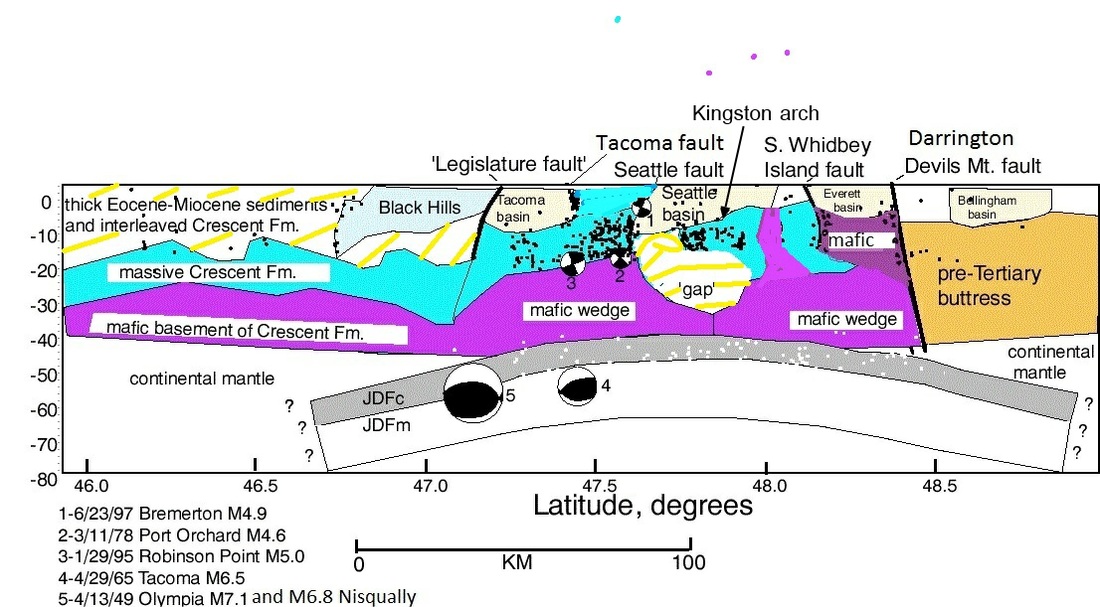
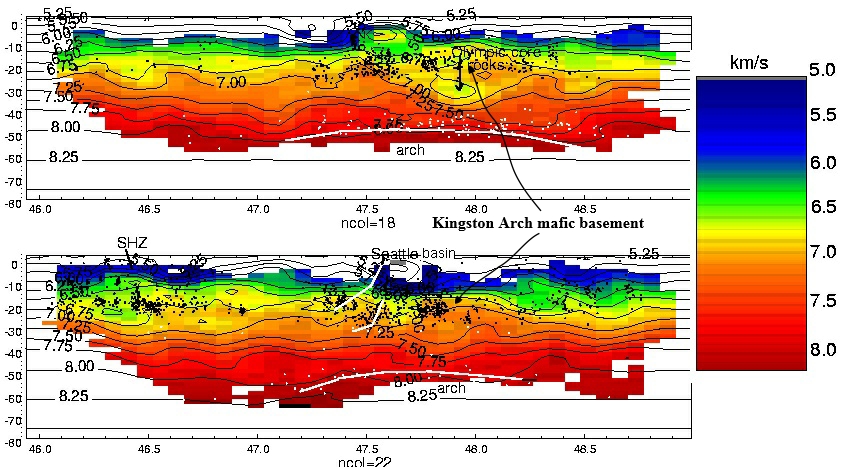
Figure 6b--Upper cross section :Interpreted geologic north south section based upon tomography with earthquakes overplotted. Lower two sections:Two of the velocity cross-sections used to construct the geologic interpretation above.
The interpretive north-south cross section in the upper graphic of Fig. 6b is based upon tomographic images such as that in the lower part of the figure as well as magnetotelluric models (Stanley et al., 1999). The interpretive section is supported by magnetic data below which provide even tighter details on boundaries of the mafic units which come near the surface. The Black Hills unit at 47.0N is a well mapped mafic unit of Siletzia which has underlying Tertiary sediments as determined by Vp/Vs data from tomography and magnetotelluric models (combined images in Stanley et al. (1999). Note that the Bremerton M4.9 (#1) and Port Orchard M4.6 (#2) earthquakes occur near the deeper parts of the Seattle fault. These two events occurred where the corner of the mafic wedge south of, and forming, the Seattle fault are in tight contact with the JDFP arch where Lamb et al. (2012) have defined a 'transfer zone The dense seismicity pattern at the NW corner of this key mafic block south of the SFZ is shown in detail in Fig. 9c.
The interpretive north-south cross section in the upper graphic of Fig. 6b is based upon tomographic images such as that in the lower part of the figure as well as magnetotelluric models (Stanley et al., 1999). The interpretive section is supported by magnetic data below which provide even tighter details on boundaries of the mafic units which come near the surface. The Black Hills unit at 47.0N is a well mapped mafic unit of Siletzia which has underlying Tertiary sediments as determined by Vp/Vs data from tomography and magnetotelluric models (combined images in Stanley et al. (1999). Note that the Bremerton M4.9 (#1) and Port Orchard M4.6 (#2) earthquakes occur near the deeper parts of the Seattle fault. These two events occurred where the corner of the mafic wedge south of, and forming, the Seattle fault are in tight contact with the JDFP arch where Lamb et al. (2012) have defined a 'transfer zone The dense seismicity pattern at the NW corner of this key mafic block south of the SFZ is shown in detail in Fig. 9c.
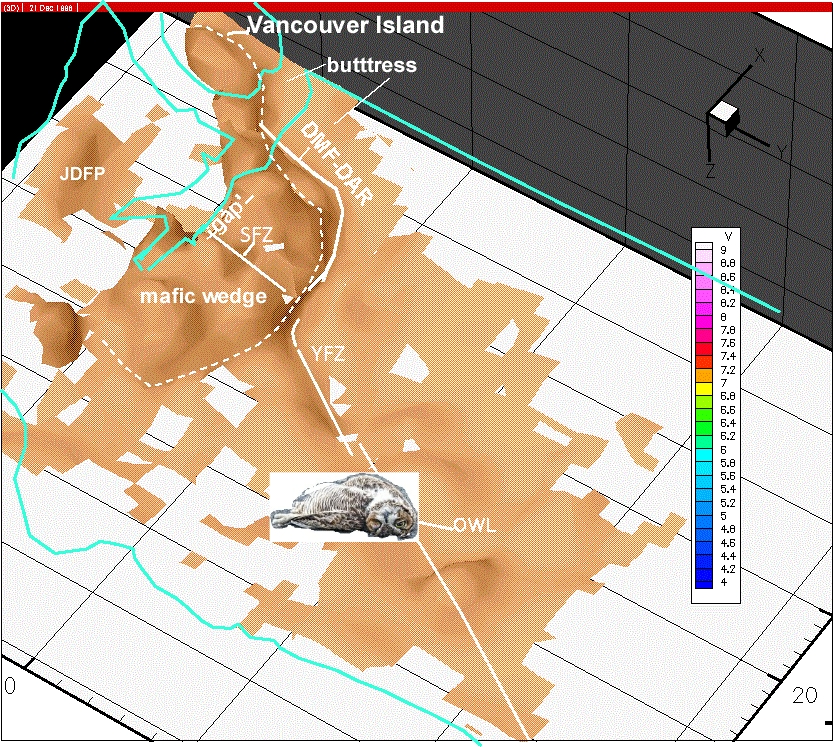
Figure 6c--Regional tomographic image compiled from a broader mesh, as discussed in Stanley et al. (1999) for a velocity of 7.0 km/s.
The broader view of tomographic results is shown in Fig. 6c where a larger grid was used. Mafic wedge units depicted in the other illustrations are seen clearly in this coarser view, with the northern most component against southern Vancouver Island forming the edge of the 'buttress' on the north side of the JDFP arch. The character of the accretionary boundary formed along the DMF-DAR (or DDMF in other illustrations) is clearly illustrated. Also of major tectonic significance is the linear zone followed by the Yakima fold zone (YFZ or YFB below), basically along the passes which Interstate 90 follows through the Cascade Range east of Seattle. The often discussed Olympic Wallowa lineament (OWL) has been discounted by us through a study of lineaments on the highly definitive national magnetic data shown in figures below. The more documentable YFB lineament can be followed in the magnetic data into northern Oregon and beyond in the region well past the Wallowa Mt. region. So we believe that it is time to retire the 'OWL' and refer to a lineament crossing the Columbia Plateau as the Yakima fold boundary, as defined by the shortening of amplitude of these folds against the older accretionary boundary of the Columbia Plateau region where the folds are concentrated. This YFB feature connects up with the intersection of the DDMF, South Whidbey Island fault and SFZ, as shown in Fig. 7 below. We interpret that the clear geophysical definition of the YFB acts to replace the OWL linear feature shown in many publications based upon certain visual characteristics.
The broader view of tomographic results is shown in Fig. 6c where a larger grid was used. Mafic wedge units depicted in the other illustrations are seen clearly in this coarser view, with the northern most component against southern Vancouver Island forming the edge of the 'buttress' on the north side of the JDFP arch. The character of the accretionary boundary formed along the DMF-DAR (or DDMF in other illustrations) is clearly illustrated. Also of major tectonic significance is the linear zone followed by the Yakima fold zone (YFZ or YFB below), basically along the passes which Interstate 90 follows through the Cascade Range east of Seattle. The often discussed Olympic Wallowa lineament (OWL) has been discounted by us through a study of lineaments on the highly definitive national magnetic data shown in figures below. The more documentable YFB lineament can be followed in the magnetic data into northern Oregon and beyond in the region well past the Wallowa Mt. region. So we believe that it is time to retire the 'OWL' and refer to a lineament crossing the Columbia Plateau as the Yakima fold boundary, as defined by the shortening of amplitude of these folds against the older accretionary boundary of the Columbia Plateau region where the folds are concentrated. This YFB feature connects up with the intersection of the DDMF, South Whidbey Island fault and SFZ, as shown in Fig. 7 below. We interpret that the clear geophysical definition of the YFB acts to replace the OWL linear feature shown in many publications based upon certain visual characteristics.
Figure 6d--East west cross section based upon tomography and earthquake data through Seattle. Intraplate events of 1949, 1965, and 2001 projected onto profile. Colored dots below mafic wedge are possible location of episodic tremor events.
The EW cross section through the subduction zone and Seattle Basin of Fig. 6d from Stanley et al. (1999) includes seismicity patterns, temperature profiles, and background locations for tremor events. Explanation of data sources and background are contained in Stanley et al. (1999), but it is important to note that the geometry of the JDFP is based upon our tomographic results and seismicity profiles with the events relocated using the tomographic velocity model. The relocated earthquakes shown as red dots were used to draw the interpretive model. Intraplate events of 1949, 1965, and 2001 are located at the change in bend of the JDFP plate dip. We have interpreted from the tomography cross-sections that the 'mafic wedge' is higher velocity than the surficial Crescent basalts. This mafic wedge may represent the core of the Siletzia mafic complex that led to emission of the upper crustal basalts in an offshore spreading center or rift. The interpreted location of the tremor episode near the arch in the JDFP suggests to us that they are directly related to the stick-slip nature of the subduction interface below the mafic wedge where mafic to mafic units occur in the interface at temperatures of 400-450 C.
AEROMAGNETIC DATA BACKGROUND FOR EARTHQUAKES
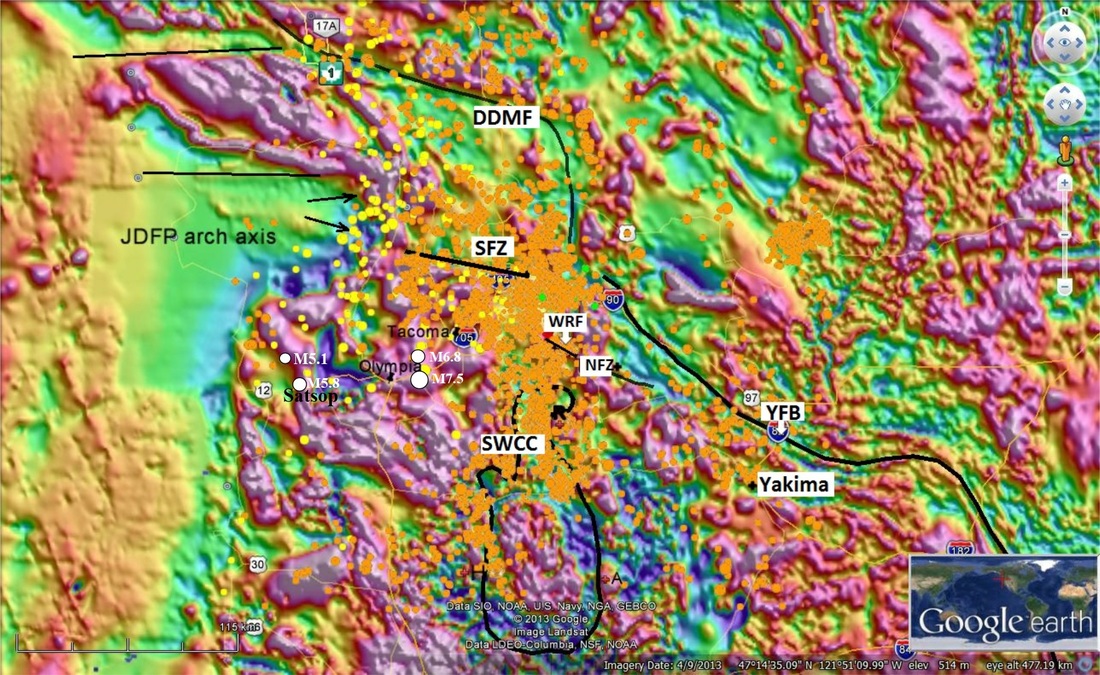
Figure 7a--Combined magnetic and seismicity data for Washington. Orange events are those above 30 km depth and yellow dots are deeper ones. Four key intraplate events are shown by white circles near Satsop in western Washington and south of Tacoma. National magnetic data taken from http://mrdata.usgs.gov/magnetic/. The expression of our interpreted boundary zone for folding in the central Columbia Plateau is labeled YFB for Yakima fold boundary. SFZ=Seattle fault zone, DDMF=Darrington Devils Mt fault zone, WRF=White River fault, NFZ=Naches fault zone, KA=Kingston arch, SWCC=southern Washington Cascades conductor (closed black line in Cascades). Two linear features in magnetic data on southern Vancouver Island and northern side of the JDFP arch are denoted by unlabeled straight black lines also show in Fig. 8.
Earthquakes in the subducting plate are shown by the yellow dots wrapping around the JDFP arch in Fig. 7. Orange dots are crustal earthquakes with a concentration of events along the SHZ (west side of SWCC) and along a northeast stepover from the SHZ to the WRZ seismicity zone just west of Mt. Rainier. Two key deep intraplate events in the Satsop area (M5.1 and M5.8, shown as white circles) have NS P-axes. The significance of these two events are discussed in a later section. A dense trend of events in the WRZ extends NS from south of Mt. Rainier to the area B noted in Figs. 3 and 4. This clearly expresses the dextral slip due to NS motion of blocks in western Washington as described in Stanley et al. (1996). The broad trend of the YFB is also indicated in this figure and in Fig. 16, with the NW end intersecting the DDMF and SWIF. The YFB is not the location of intense small earthquakes, but there is a distinctive linear zone near the magnetic definition of this feature. A dense patch of seismicity occurs at the NW corner of the Columbia Plateau near Entiat WA at the site of the 1872 M7.5 crustal event.
The interpreted White River fault (WRF) and associated Naches fault zone (NFZ) shown cutting across Tertiary volcanic core rocks (the NS trending magnetic high) between Mt. Rainier and our defined YFB is shown on many geologic maps, but the actual evidence for tectonic activity on this fault is sketchy. Recent detailed investigations by the senior author where the fault supposedly crosses into the Puget Lowland region indicates that there is only evidence for equally dipping beds of Tertiary Ohanapecosh Fm. volcanics on the north side and volcanics of the Fifes Peak Fm. on the south side of the proposed fault. There is no evidence for fracturing or alteration which would be expected for a fault that crosses the Puget Lowland and connects to the Tacoma fault zone as proposed by Blakely et al. (2011). Also there is no seismicity associated with the proposed WRF as there is with the Tacoma fault. Ground magnetic profiles indicate no alteration signature which could be expected of an active fault.
BROAD REGIONAL STRUCTURE
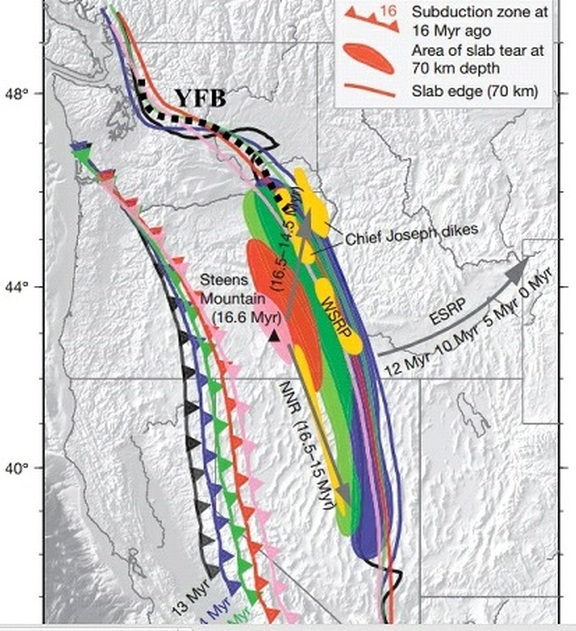
Figure 7b--Interpretation of Farallon plate dynamics related to Steens Mt. and Columbia RIver basalts by Liu and Stegman, 2012, with our YFB feature shown by black dashed line.
The YFB feature shown in the magnetic data of Fig. 7a is interpreted by us following the model of Liu and Stegman to be connected with the subduction zone characteristics of the Farallon plate system from 16-12 Ma. They use the model in Fig. 7b to explain Columbia Basin, Steens Mt., and Yellowstone vulcanism. To quote their abstract:
"The origin of the Steens–Columbia River (SCR) flood basalts, which is presumed to be the onset of Yellowstone volcanism, has remained controversial, with the proposed conceptual models involving either a mantle plume, or back-arc processes. Recent tomographic inversions based on the USArray data reveal unprecedented detail of upper-mantle structures of the western USA and tightly constrain geodynamic models simulating Farallon subduction, which has been proposed to influence the Yellowstone volcanism. Here we show that the best-fitting geodynamic model depicts an episode of slab tearing about 17 million years ago under eastern Oregon, where an associated sub-slab asthenospheric upwelling thermally erodes the Farallon slab, leading to formation of a slab gap at shallow depth. Driven by a gradient of dynamic pressure, the tear ruptured quickly north and south and within about two million years covering a distance of around 900 kilometres along all of eastern Oregon and northern Nevada. This tear would be consistent with the occurrence of major volcanic dikes during the SCR–Northern Nevada Rift flood basalt event both in space and time. The model predicts a petrogenetic sequence for the flood basalt with sources of melt starting from the base of the slab, at first remelting oceanic lithosphere and then evolving upwards, ending with remelting of oceanic crust. Such a progression helps to reconcile the existing controversies on the interpretation of SCR geochemistry and the involvement of the putative Yellowstone plume. Our study suggests a new mechanism for the formation of large igneous provinces."
We interpret that the YFB feature evident in the magnetic data was formed by the plate margin dynamics of the subducting Farallon plate against the older continental edge.
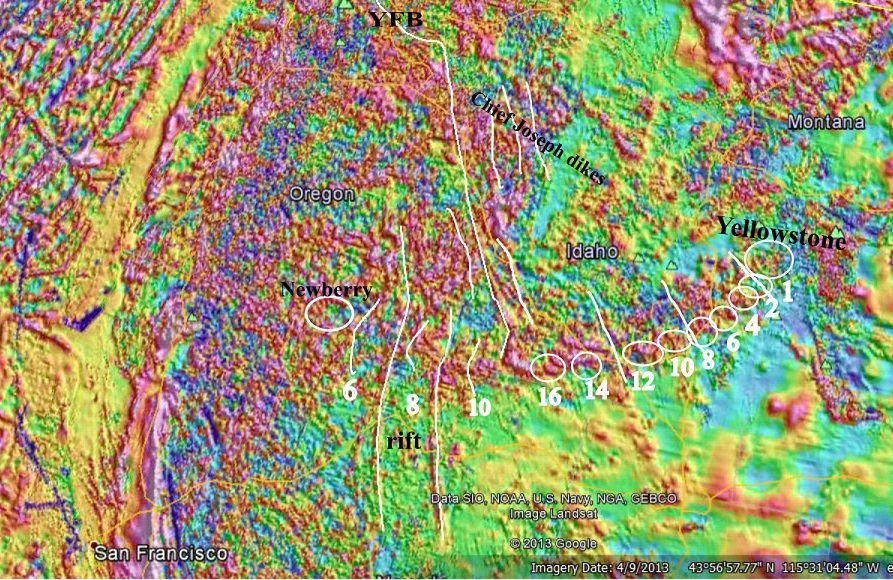
Figure 7c--Key Farallon plate subduction related structures shown on magnetic map.
Other Farallon plate dynamics, as well as the detail outlined by Liu and Stegman stand out quite clearly in the magnetic data. The YFB feature extends down to the western Snake River Plain as a slightly eastward stepover in the Farallon upwelling at the north end of the Nevada rift system and connecting to the western Snake River plain-ESRP (eastern Snake River plain). This figure and many others based on geologic/geochemical data make it clear that the western Snake River Plain is a much different structure than the ESRP. We agree with Liu and Stegman that the 'Yellowstone hotspot' is likely the eastern migration of the upwelling caused by fracturing of the Farallon plate and mantle upwelling. In our view this fracture may have been generated by curvature in the continental margin plus slab tear and other details of the Farallon era, rather than an eastward moving, incoming mantle plume. Another good summary of the 'anti-hotspot' view is provided by James et al. (2011). He discusses in detail the isotopic, tomographic, and tectonic data that cannot support the concept of a simple deep mantle plume giving rise to the volcanism of the SNRP and Yellowstone region, including the western SNRP and Oregon High River Plains. He goes further than Liu and Stegman in strongly coordinating the evidence to a subducting plate tear to SNRP volcanism. James et al. (2011) state: 'Holocene volcanism occurs all along the SRP, not just at Yellowstone, and continues along the High Lava Plains from eastern Oregon to Newberry Volcano. Young volcanism in the region thus shows better coherence to the position of the slab gap than to a spot-source like a plume.'
DETAILS OF PUGET SOUND REGION
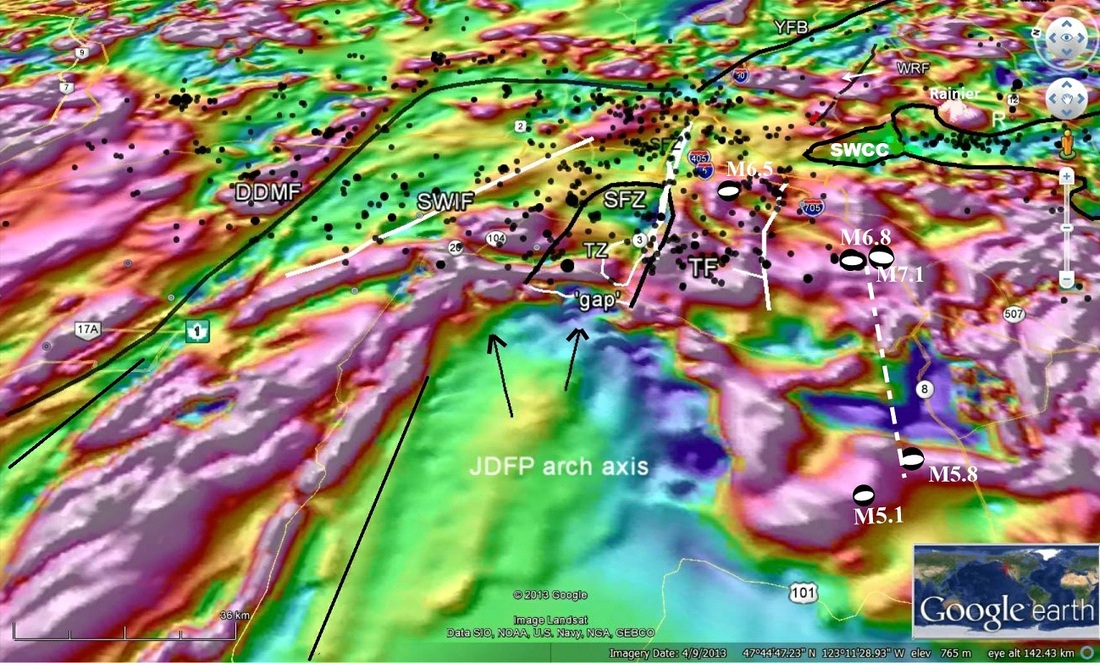
Figure 8--Tilted view of magnetic data in Google Earth outlining details of data over the JDFP arch and the important faults in the area. SFZ=Seattle fault zone, TF=Tacoma fault, TZ(white outline)=transfer zone of Lamb et al. (2012), SWCC=southern Washington Cascades conductor, SWIF=Southern Whidbey Island fault, DDMF=Darrington Devils Mountain fault zone, YFB=Yakima fold boundary, WRF=White River fault proposed location.
The black arrows on the nose of the arch in Fig. 8 are drawn to indicate detailed structures of the arch interpreted from Fig. 5 streamlines and magnetic features shown in more detail in Fig. 9. Four key intraslab earthquake are shown by their focal mechanisms. Magnetic data from the National Map shows the mafic blocks on either side of the 'gap' shown in the tomographic results that are the tectonic control for the Seattle Basin. The most obvious magnetic lineations in the JDFP arch axial region merge into the gap area. A distinct magnetic lineament follows the SWIF and this fault is probably a major NW shear loci that distributes stress from the Columbia Plateau region along the YFB toward the backstop of Vancouver Island where the DDMF and SWIF meet. This area has been mapped in great detail at the junction where this meeting occurs and incorporates the shorter Rattlesnake Mt. fault zone (RMFZ) as discussed by Sherrod et al. (2008). This smaller fault is shown in Fig. 9A below. Thus the stress in the area on the east side of the Puget Lowland is distributed largely along the SFZ, the SWIF, YFB, and DDMF. The seismicity pattern concentrates at the junction of these key fault/boundary zones.
The magnetic low trend along the south flank of the arch is quite pronounced and may be significant since intraplate earthquakes on this flank have suggested to some that there may be a tear in the SE flank of the arch (possible location shown by dashed white line in Fig. 8) as discussed in Stanley et al. (1999) and McCrory et al.(2003). However, close examination of the two Satsop deep intraplate events in 1999 (M5.1 and M5.8) reveal that focal mechanisms have a largely NS P-axis that line up with the trend of the mafic unit (as shown by the magnetic anomaly) pushing northward on the arch flank. A similar relationship may exist for the M7.1 Olympia and the M6.8 Nisqually intraplate quakes, suggested by the position of these large quakes just under the main mafic unit (see Fig. 8 for surface location and Fig. 6b for a cross-section view).
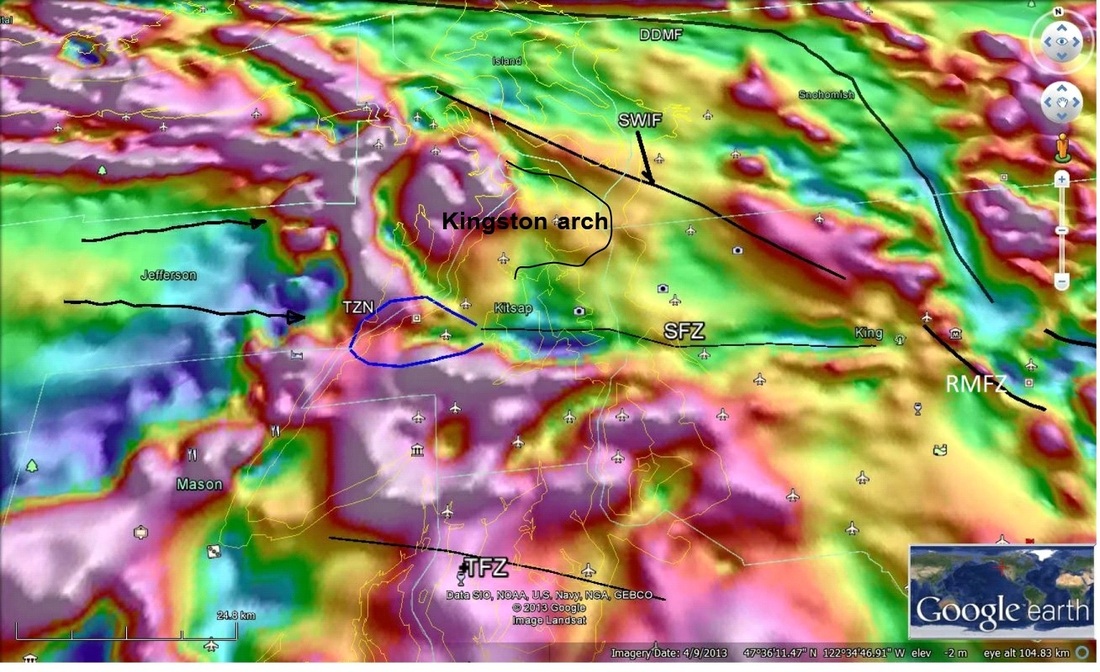
Figure 9(A) --Blowup of magnetic data in the critical Seattle fault zone near the nose of the JDFP arch. TZN denoted by the blue line is the 'transfer zone' mapped by Lamb et al. (2011). Other symbols are as in other figures. The black lines on the nose of the arch are drawn to indicate detailed structures of the arch interpreted from Fig. 5 streamlines and magnetic features also shown in Fig. 7 and 8.
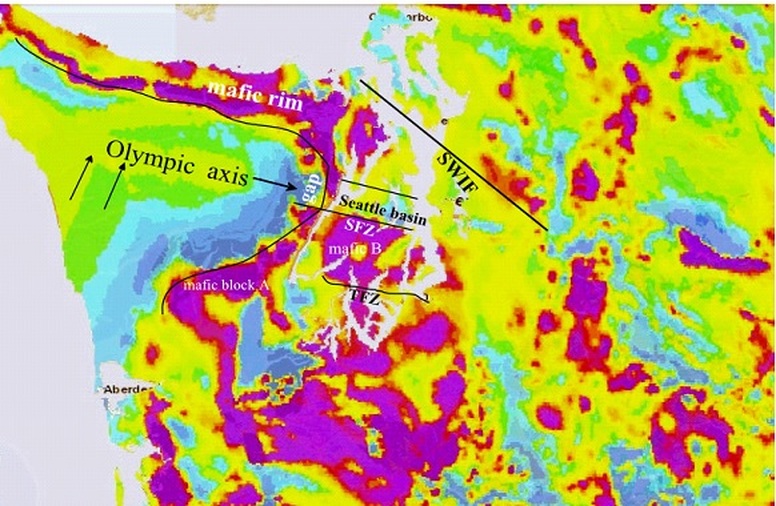
Figure 9B--Compressed color code range of magnetic field with TFZ=Tacoma fault zone, SFZ=Seattle fault zone. Three key mafic blocks are labelled, A, B, C. Arrows denote interpreted main motion, including the long arrow in the Olympics which is the direction of subduction
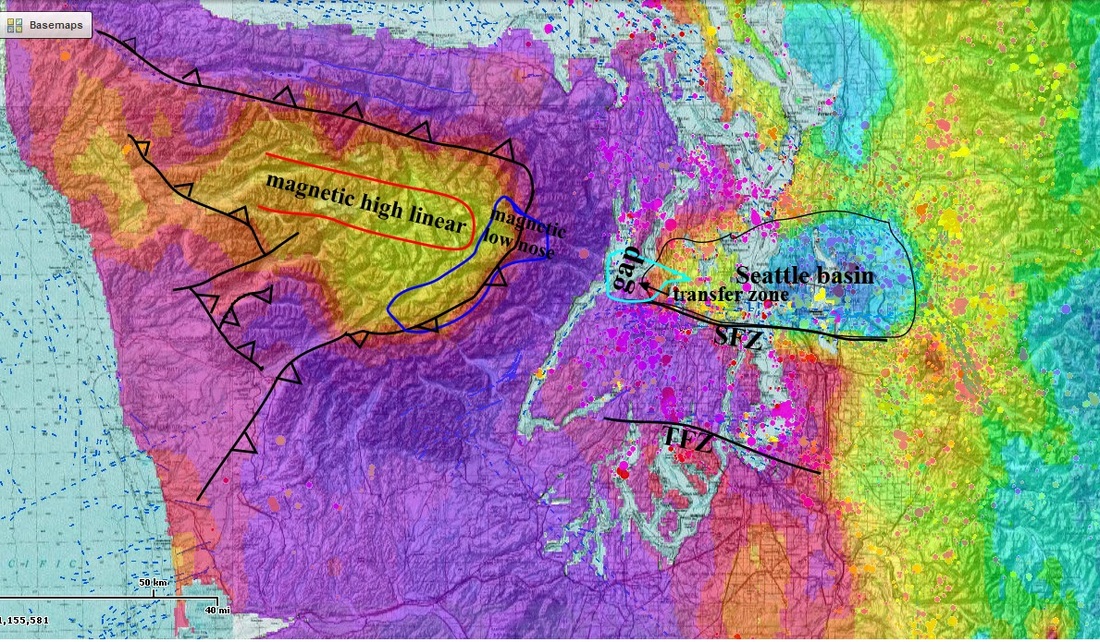
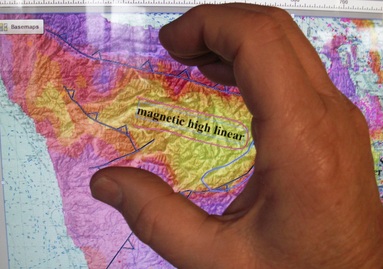
Figure 9C--Composite of gravity data, seismicity, and geologic structure with a severe and narrow compression in the Olympics portrayed with small image of hand overlay below. The linear magnetic high and a related magnetic low nose shown as well .
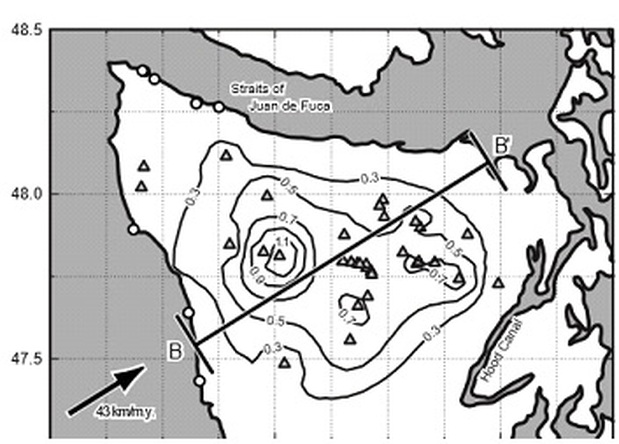
Figure 9D--Uplift rates in km/m.y. for the Olympic complex reproduced from Brandon et al. (1998).
Highly magnetic mafic blocks form the north and south sides of the Seattle basin, although the portion on the north side of the basin (and 'gap') may be genetically connected to the larger complex wrapping around the arch region. This connection would be in the Kingston arch area (Fig. 9A and B). The arrow on the north side of the Olympic core complex in Fig. 9A indicates the fundamental direction of subduction of the arch and the main deformation axis as shown in the shape indicted by the streamlines of Fig. 5. The arrow directed ESE along the magnetic high trend in the core complex apparently follows the main axis of deformation, as shown in the uplift data of Fig. 9D and the alternative magnetic plot of Fig. 9B. NNE arrows south of the end of the trend of the axis (near the 'O' in 'Olympic axis') show the direction of NS compression that extends this far out in the Olympic Peninsula, also indicated in the gravity data of Fig. 9C. The transfer zone at the west end of the SFZ (FIg. 9A) occurs in a particularly complex setting. This transfer zone as defined by Lamb et al. (2011) was based upon small, complex surface fold zones where the surface trace of the SFZ starts to become unclear. This feature occurs where the magnetic low associated with the Seattle basin seems to dive under the rim of Crescent basalts to connect with the linear magnetic feature axis in the Olympic complex structure. We suggest that the data present a clear picture of compression of the axis of the Olympic core complex by the northward compression of the complex and shoving of this axis toward the gap in the mafic rocks that form the margins of the Seattle basin, as defined on the south side by the SFZ. The rim of Crescent basalts has been almost broken through in the 'gap' area. The tomography data and the magnetic data suggest that the mafic block that has the SFZ as its northern boundary is in contact with the arch in the JDFP. These combined structures are more signficant toward understanding the overall earthquake hazards in the region than any other tectonic features. The north south compression of the Olympic core is illustrated even better by the gravity data shown in Fig. 9C. As with the magnetic data, gravity data outline the underlying mafic rocks of Siletzia and related iron rich rocks. The tight closing of the core of the Olympics is portrayed by the hand-over-rocks illustration below the main part of Fig. 9C. This phenomena must be visualized accurately to understand Juan de Fuca bend/Olympic core area tectonics such as we present in this report. The NW trending thrusts shown in Fig. 9C that align with the 'thumb' of the gravity data were first mapped in detail by Tabor and Cady (1978). There is some difference in the gravity and magnetic data regarding the expression of the gap through the Crescent rim. The gap shows as a magnetic low that lines up with the ESE magnetic high and with the tomographic expression of the gap and the Seattle fault. This is likely due to the fact that the surficial part of the Crescent rim and its variations affect the magnetic data more than the gravity data and the underlying mafic wedge shown in Fig. 6d derived from the tomography more closely affects the gravity.
The details that we discuss regarding the Seattle fault and possible interaction with the JDFP arch, etc. are the most recent of key interpretations that started with the tectonic setting derived from seismic reflection profiles discussed by Pratt et al. (1997), the background from seismic tomography outlined by Stanley et al. (1999), and the character of the 'transfer zone' outlined by Lamb et al. (2012). The tremor details and background provided by the magnetic data combined with earlier tomography that we discuss provide more possibility for understanding the active tectonics and earthquake hazards for the region.
RELATIONSHIP OF SEATTLE FAULT AND SUBDUCTION ZONE QUAKES
The highly connected and complex stress setting of the arch area, with our interpreted tight coupling of the western part of the SFZ to the arch suggests that there may be a relationship between the 1100 BP SFZ earthquake and a Cascadia subduction earthquake that may have occurred at about the same time in northern and central Cascadia as interpreted by Nelson et al., 2006. It seems reasonable that a northern JDFP quake could trigger the highly unstable zone at the west end of the SFZ. These more recent details support earlier suggestions by Stanley et al. (1999):
'Evidence cited earlier from Atwater (1992) for deep sand blows near the Washington coastline at the mouth of the Copalis River in the interval 900-1300 years ago correlates with the timing of earthquake deformation in Puget sound. Meyers et al. (1996) have also found earthquake-subsidence events near the mouth of the Columbia River, one of which is radiocarbon dated at 1110±60 yr B.P. These earthquake indicators near the Washington coastline correlate with the Puget Sound indicators dated at ~1100 yr B.P., suggesting a common cause. Atwater et al. (1997) documents other sites of sand volcanoes that may be related to large earthquakes during the 900-1300 year interval along the northwest coastline of the Olympic Peninsula, again suggesting a possible large subduction zone earthquake about this time. Supporting evidence for a large Cascadia subduction earthquake during this interval also is cited by Carver et al. (1996) who interpret that a tsunami deposit near Crescent City, California dated at 670-1173 years ago was due to a single Cascadia event. We interpret that the best explanation for the widespread evidence for large earthquakes at ~1100 yr B.P. involves a subduction thrust earthquake initiated in the deep locked region under Puget Sound. Such an event would have created large ground motions in the Puget Sound region. If the earthquake involved only 100-150 km strike length of the thrust with a M~8.0 in the Puget Sound region, and possibly did not propagate to the shallowest part of the thrust offshore, it would not have generated a great tsunami similar to the one documented for the 1700 A. D. subduction zone earthquake (Satake et al., 1996). The proposed earthquake may have destabilized the frictional points in the overlying the key block of Crescent Fm., causing release of both JDFP generated stress and that arising from margin parallel shear. Deformation in the key block of Crescent Formation and surrounding blocks would have been complex, as observed in paleoseismicity results, dependent upon the block thicknesses, strength, and local state of stress. Large crustal earthquakes might have occurred over a period of several hundred years, as the stresses reoriented to the loss of the deep traction force. Remote triggering of earthquakes within the Puget Sound region may have also played a factor in the paleoseismic observations. An example of large crustal fault motion connected with a subduction thrust earthquake comes from the 1964 Alaska great earthquake (M8.4). The largest uplifts were documented along the Patton Bay fault that runs through Montague Island, with offsets of over 10 meters measured (Plafker, 1969). Although the Seattle fault is not oriented parallel to the subduction zone, release of underlying traction forces at the plate boundary might be the trigger for the key Crescent block on the south side of the Seattle fault to jump to the north (because of stored north-south compressive stress). The cause of triggering of the deep locked zone could be seismic or aseismic slip on the offshore locked zone, a buildup of high-pore pressures in the thrust, or the occurrence of a large intraslab earthquake.'
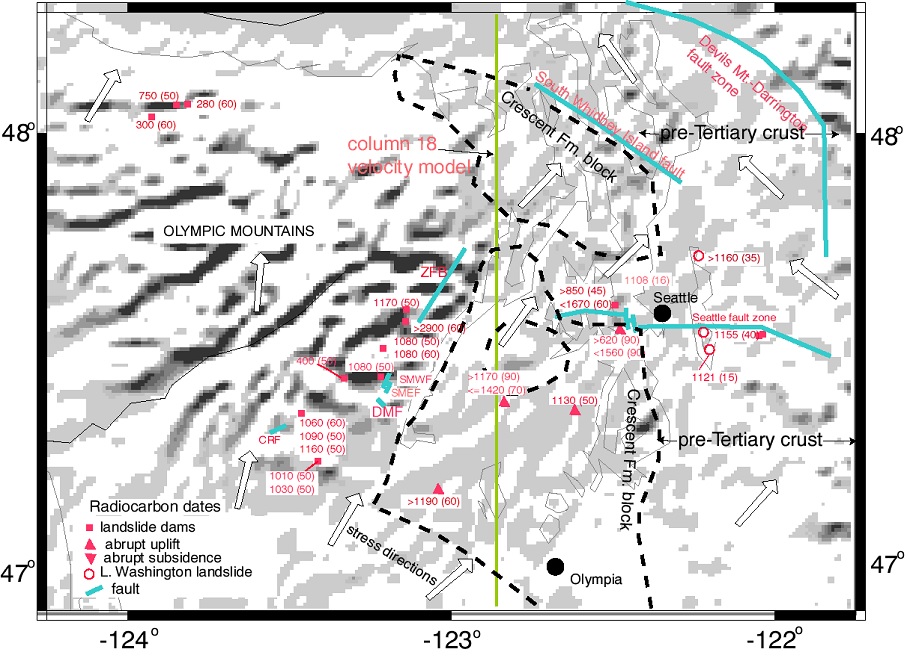
Figure 10--Summary of evidence for ~1100 BP seismic event of large magnitude in the Puget Lowland region reproduced from Stanley et al. (1999). Data points referenced in that report. CRF=Canyon R. fault, DMF=Dow Mt. fault, SMWF=Saddle Mt. West fault, SMEF=Saddle Mt. East fault, ZFB=zone of fractured basalt of Glassley, 1974.
As noted in Stanley et al. (1999) for the data shown in Fig. 10, evidence from radiocarbon dating of landslide-formed dams (square symbols from data summary from Logan et. al.,(1998), Lake Washington landslides (Karlin and Abella, 1992) coupled with dating of abrupt uplift and subsidence in estuaries(triangles from Bucknam et al., 1992), strongly suggests regional effects of a ~1100 yr B. P. earthquake. It has been generally assumed that this event was largely a crustal earthquake with magnitude of ~M7.5. The distribution of landslides and subsidence/uplift features suggests that the earthquake involved a main key block of Siletzia's Crescent Fm. (dashed outline) that we identify from velocity models. The outline of this block is even more clearly indicated by the magnetic data of Fig. 9B. This block is in faulted contact at ZFB and other places (Glassley, 1974) with the shallow, thin separate unit of mafic rocks that rim the Olympic Peninsula. Our subduction zone model, based upon tomographic images and stress analysis, suggests that the key mafic block outlined in the figure above is locked into the mantle wedge below and to the underlying Juan de Fuca plate against the southeast nose of the arch in this subducting plate. This combined structure may represent a deep asperity in the subduction thrust zone and corresponds to the 'transfer zone' suggested by Lamb et al. (2011). A large earthquake here at 1100 yr B. P. may have been a complex event involving the key mafic blocks clearly defined in the magnetic data. The key block was likely responding to release of coupling stresses below it, generating large crustal motions, especially along the Seattle fault zone. As mentioned earlier, a similar process occurred in the 1964 Alaskan subduction zone event, where the Patton Bay fault on Montague Island was the focus of the largest crustal uplift, but in a relatively slowly propagating manner (Plafker, 1969). The energy release was characteristic of the subduction thrust slip, and not of a simple crustal faulting event along the Patton Bay fault (Plafker, 1969).
As noted in Stanley et al. (1999) for the data shown in Fig. 10, evidence from radiocarbon dating of landslide-formed dams (square symbols from data summary from Logan et. al.,(1998), Lake Washington landslides (Karlin and Abella, 1992) coupled with dating of abrupt uplift and subsidence in estuaries(triangles from Bucknam et al., 1992), strongly suggests regional effects of a ~1100 yr B. P. earthquake. It has been generally assumed that this event was largely a crustal earthquake with magnitude of ~M7.5. The distribution of landslides and subsidence/uplift features suggests that the earthquake involved a main key block of Siletzia's Crescent Fm. (dashed outline) that we identify from velocity models. The outline of this block is even more clearly indicated by the magnetic data of Fig. 9B. This block is in faulted contact at ZFB and other places (Glassley, 1974) with the shallow, thin separate unit of mafic rocks that rim the Olympic Peninsula. Our subduction zone model, based upon tomographic images and stress analysis, suggests that the key mafic block outlined in the figure above is locked into the mantle wedge below and to the underlying Juan de Fuca plate against the southeast nose of the arch in this subducting plate. This combined structure may represent a deep asperity in the subduction thrust zone and corresponds to the 'transfer zone' suggested by Lamb et al. (2011). A large earthquake here at 1100 yr B. P. may have been a complex event involving the key mafic blocks clearly defined in the magnetic data. The key block was likely responding to release of coupling stresses below it, generating large crustal motions, especially along the Seattle fault zone. As mentioned earlier, a similar process occurred in the 1964 Alaskan subduction zone event, where the Patton Bay fault on Montague Island was the focus of the largest crustal uplift, but in a relatively slowly propagating manner (Plafker, 1969). The energy release was characteristic of the subduction thrust slip, and not of a simple crustal faulting event along the Patton Bay fault (Plafker, 1969).
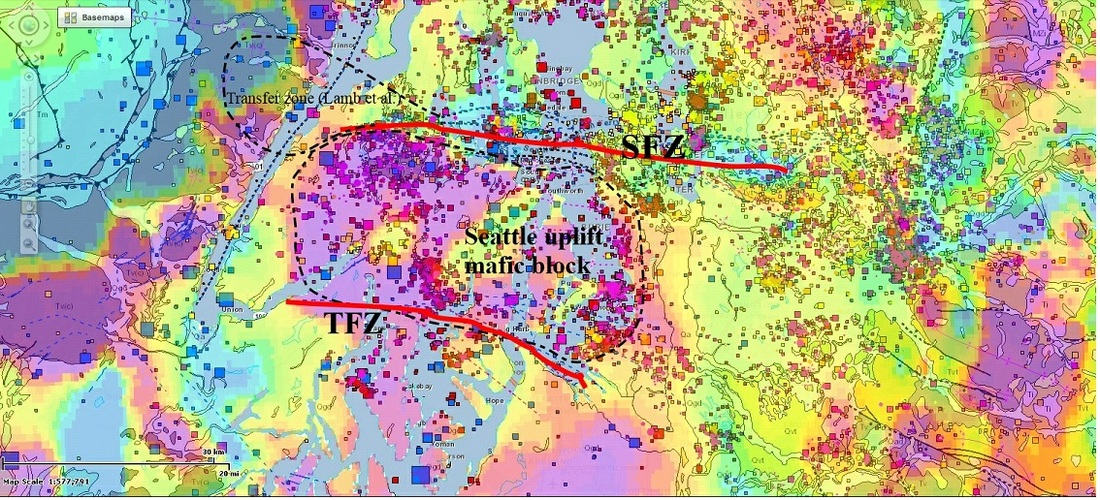
Figure 11--Detail of the Seattle and Tacoma fault zones which are at the boundaries of the well mapped mafic block revealed by the magnetic data (reds) Earthquakes, aeromagnetic data and geology copied from the DNR (Dept. Natural Resources, Washington State) web site .
The outline of the mafic block between the Seattle and Tacoma faults is again well illustrated by magnetic data displayed over the geology and detailed seismicity plotted in Fig. 11. The sharp concentration of seismicity at the NW corner of the mafic block is likely due to the corner stresses in this block being pushed against the downgoing JDFP or deeper mafic units just above the plate. The transfer zone of Lamb et al. (2011) occurs where the Seattle/Tacoma (uplift block) mafic block impinges against the more continuous mafic units wrapping the Olympic core complex and where there appears to be a gap in these units as shown in Fig. 9B.
The outline of the mafic block between the Seattle and Tacoma faults is again well illustrated by magnetic data displayed over the geology and detailed seismicity plotted in Fig. 11. The sharp concentration of seismicity at the NW corner of the mafic block is likely due to the corner stresses in this block being pushed against the downgoing JDFP or deeper mafic units just above the plate. The transfer zone of Lamb et al. (2011) occurs where the Seattle/Tacoma (uplift block) mafic block impinges against the more continuous mafic units wrapping the Olympic core complex and where there appears to be a gap in these units as shown in Fig. 9B.
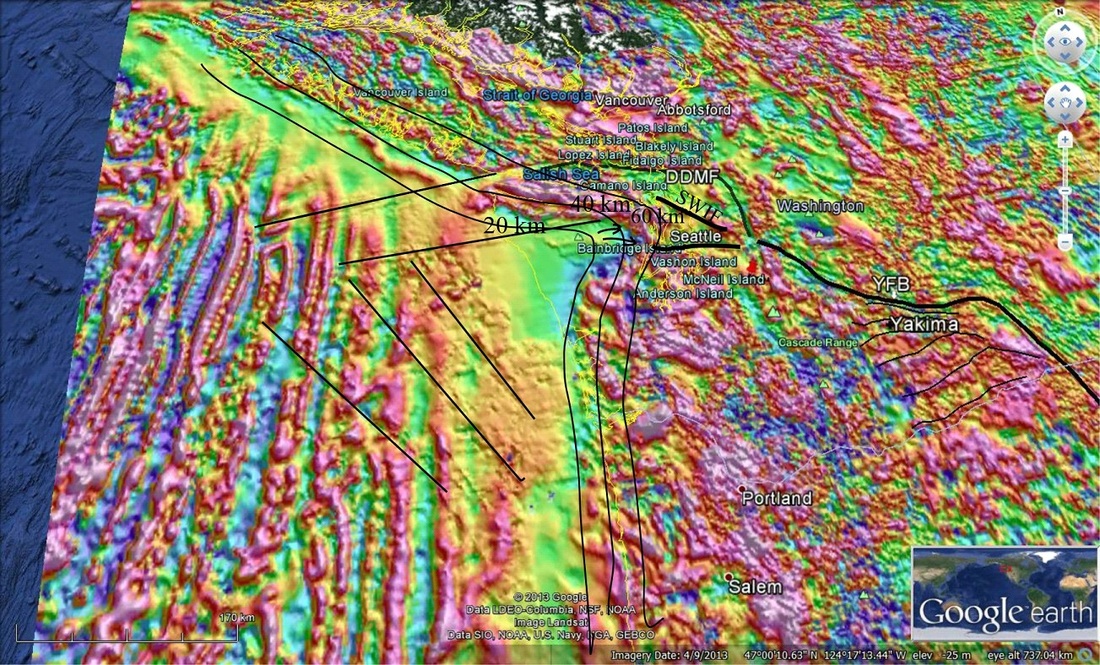
Figure 12--Large area view of National Magnetic Map data. Depth contours to the subducting JDFP are shown at 20, 40, and 60 km as interpreted for the Olympic Peninsula and Puget Lowland region based upon our seismic tomography results and seismicity patterns.
A large scale view of the magnetic data in Fig. 12 adds further clarification to the tectonic setting of western Washington. Interpreted contours of depth to JDFP are shown at 20, 40, and 60 km. The two arrows that reflect JDFP arch geometry defined in Fig. 5 are shown. Long black lines trending NW offshore from the Oregon coastal region define magnetic features that cross the main NS spreading pattern. Two such lines also trend NE, with the northern one cutting across southern Vancouver Island and toward the DDMF. The DDMF is at the boundary of the mafic complex on the north side of the JDFP arch (and Olympic Mts) and the Wrangellia core of Vancouver Island and this boundary seems to be a possible shear zone that extends well offshore, as indicated by the magnetic data.
EPISODIC TREMOR AND SLIP
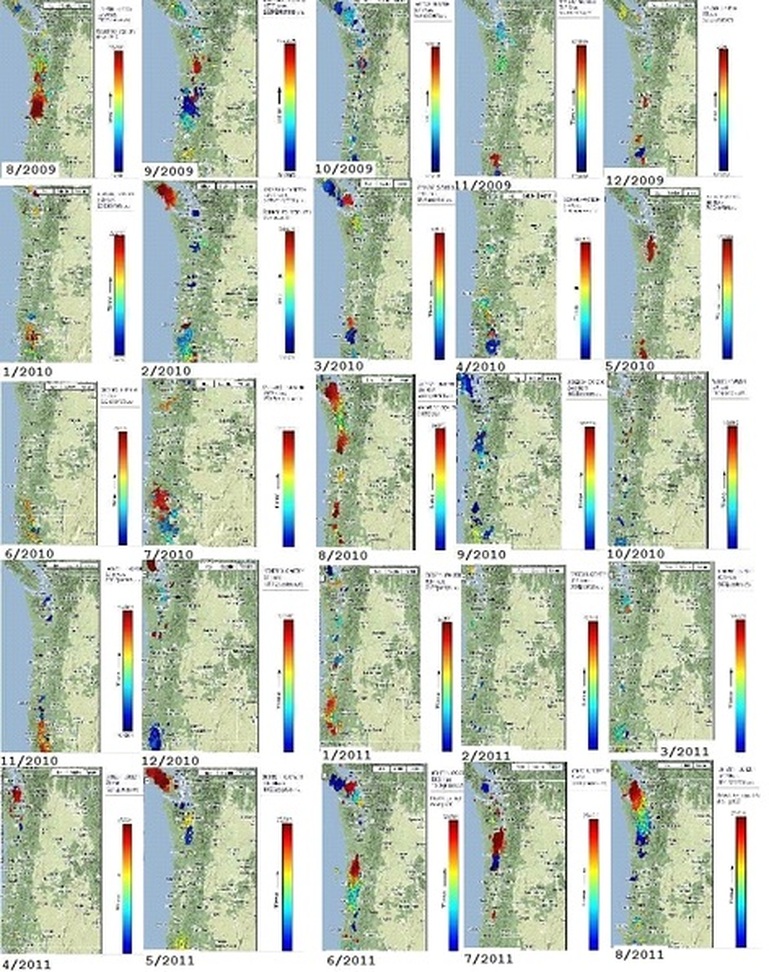
Figure 13a--Sample plots of episodic tremor for 2009 to 2012 period from PNSN interactive web site.
The representative summary images of episodic tremor in Fig. 13 illustrate key factors of the tremor behavior. The mafic cored coast ranges of Oregon and the high velocity core of Vancouver Island formed by the Wrangellia terrane backstop illustrate the most massive portions of these terranes. But the most active tremor area is that surrounding the plate arch under the Olympic Mountains and Puget Lowland. Audet et al. (2010) have proposed a conceptual model for the generation of ETS where the occurrence and recurrence of propagating slow slip and low-frequency tremor are explained by episodic pore fluid pressure buildup and fluid release into or across the plate boundary. However, we interpret that tremor patterns located in these two regions are easily understood from the geometry of the regions as mapped in subduction earthquakes, seismic tomography, and gravity and magnetic models. The JDFP subducting beneath central Oregon dips steeper than it does under Vancouver Island and under the Olympic Mts region, where the plate dips shallowest. The shallow dip under the Olympic Mts region is associated with folding of the plate into an arch with the dip modification accommodating this structural arch. Imbrication of crustal blocks also occurs under Vancouver Island and opening of the bend in the oceanic-continental margin allows a shallower oceanic plate dip than occurs under Oregon, but steeper than in the JDFP plate arch. More details of the year to year tremor can be found at the senior author's website http://cascadiageophysics.com and at the Pacific Northwest Seismic Network site http://www.pnsn.org/tremor/overview. This excellent data set is due to the comprehensive installation of measurement sites and online data availability, with the latter being developed by Aaron Wech (Wech, 2010, Wech and Creager, 2011, Wech et al., 2010).
The representative summary images of episodic tremor in Fig. 13 illustrate key factors of the tremor behavior. The mafic cored coast ranges of Oregon and the high velocity core of Vancouver Island formed by the Wrangellia terrane backstop illustrate the most massive portions of these terranes. But the most active tremor area is that surrounding the plate arch under the Olympic Mountains and Puget Lowland. Audet et al. (2010) have proposed a conceptual model for the generation of ETS where the occurrence and recurrence of propagating slow slip and low-frequency tremor are explained by episodic pore fluid pressure buildup and fluid release into or across the plate boundary. However, we interpret that tremor patterns located in these two regions are easily understood from the geometry of the regions as mapped in subduction earthquakes, seismic tomography, and gravity and magnetic models. The JDFP subducting beneath central Oregon dips steeper than it does under Vancouver Island and under the Olympic Mts region, where the plate dips shallowest. The shallow dip under the Olympic Mts region is associated with folding of the plate into an arch with the dip modification accommodating this structural arch. Imbrication of crustal blocks also occurs under Vancouver Island and opening of the bend in the oceanic-continental margin allows a shallower oceanic plate dip than occurs under Oregon, but steeper than in the JDFP plate arch. More details of the year to year tremor can be found at the senior author's website http://cascadiageophysics.com and at the Pacific Northwest Seismic Network site http://www.pnsn.org/tremor/overview. This excellent data set is due to the comprehensive installation of measurement sites and online data availability, with the latter being developed by Aaron Wech (Wech, 2010, Wech and Creager, 2011, Wech et al., 2010).
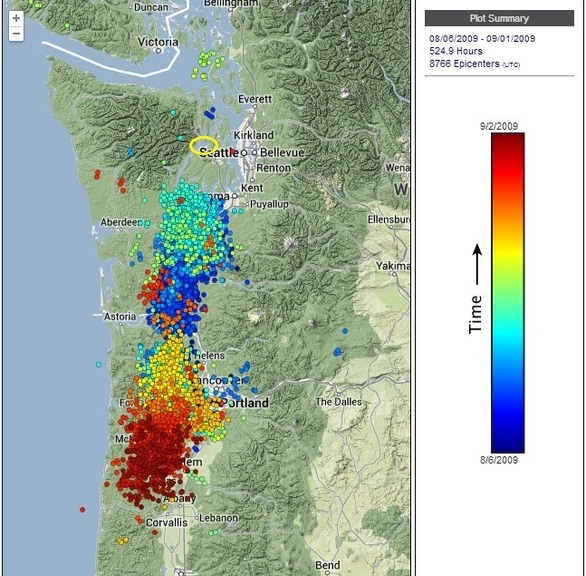
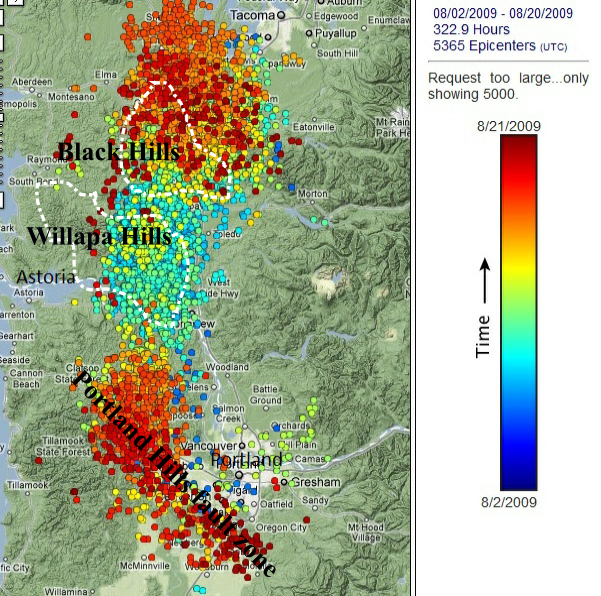
Figure 13b--Episodic tremor pattern for Fall 2009 which was focused on the central Oregon coast range after starting in the Willapa-Black Hills area of Washington. Yellow ellipse west of Seattle in upper panel is the 'transfer zone' discussed in text above. The lower panel is a narrower time interval to show the tremor associated with the Portland Hills fault zone region.
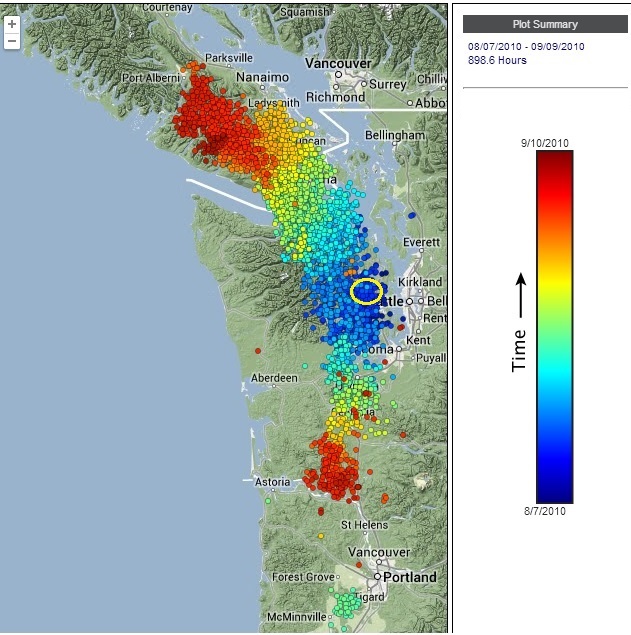
Figure 13c--A typical early Fall tremor episode of 2010 which started just west of Seattle in the 'transfer zone' and spread north and south across southern Vancouver Island and down to the Columbia River on the south end.
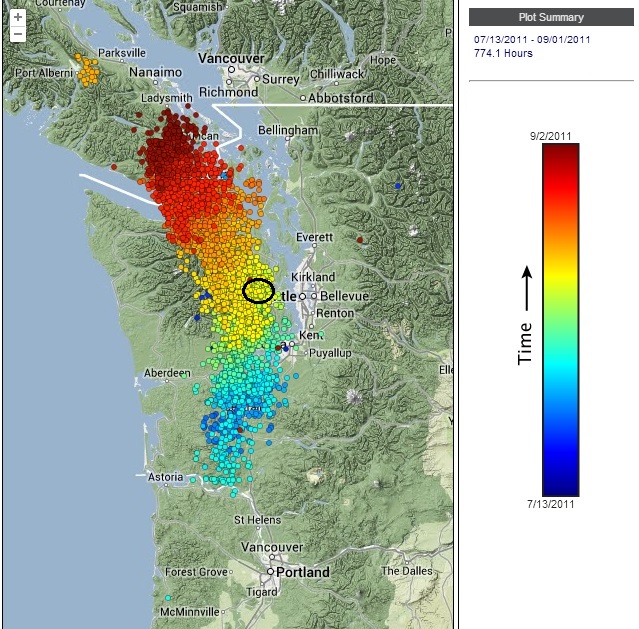
Figure 13d--Fall 2011 tremor episode which started in the Black Hills area south of Olympic and continued northward to southern Vancouver Island without activating the 'transfer zone' shown as black ellipse west of Seattle in this view.
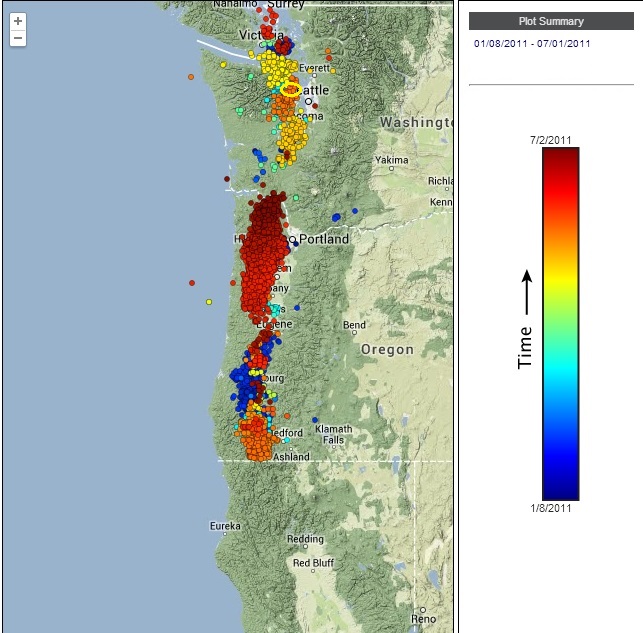
Figure 13e --Broadly timed tremor activity starting in the southern Oregon coast range and then highly focused in the northern Oregon coast range, both underlain by the Siletzia complex.
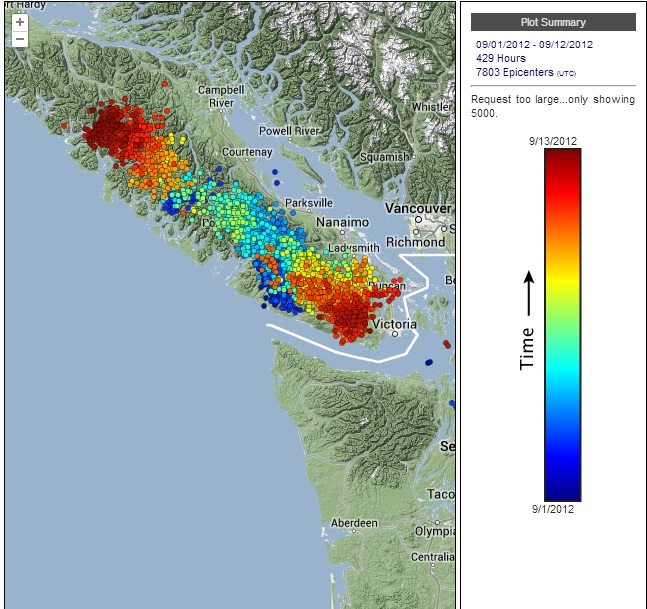
Figure 13f--Fall 2012 tremor episode which started in central Vancouver Island
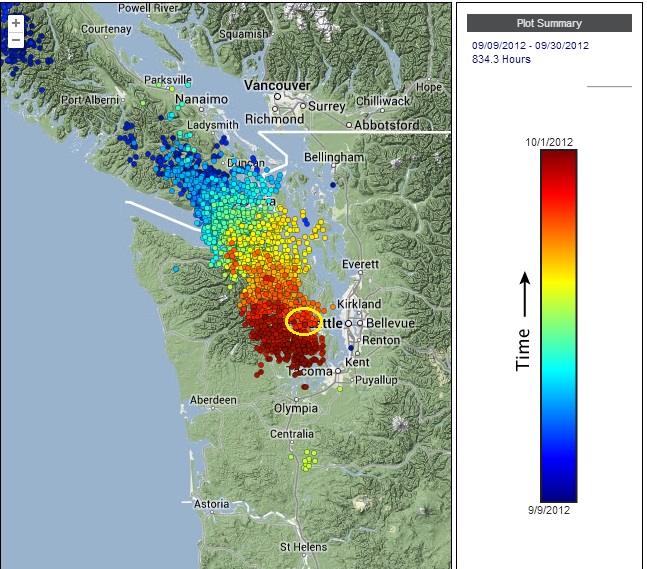
Figure 13g--Fall 2012 tremor episode continued from Vancouver Island to the west end of Seattle fault
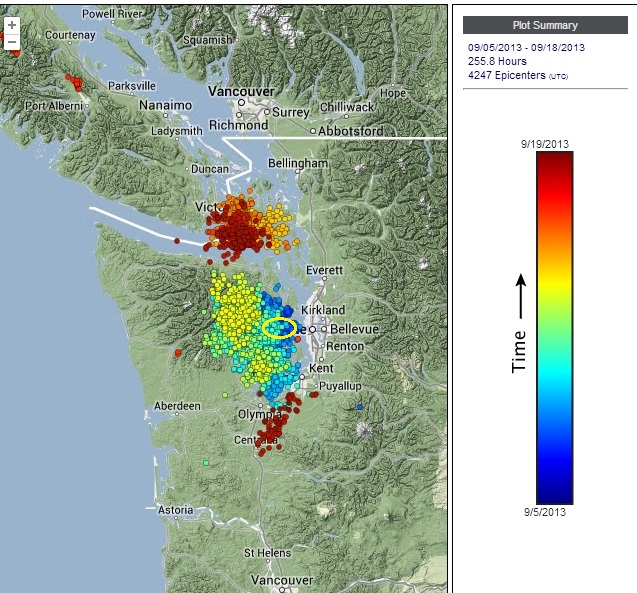
Figure 13h--Tremor episode for Fall 2013 which started near the west end of the Seattle fault and moved north, south and updip.
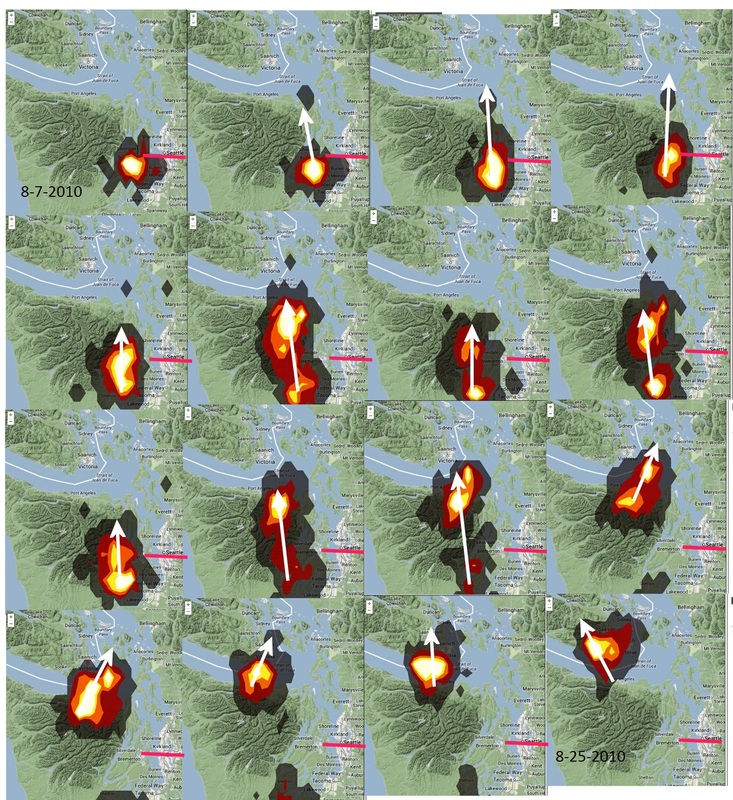
Figure 14a--Tremor patterns for period 8-7-2010 to 8-25-2010. Red line is the Seattle fault location and white arrows show the migration of each tremor pattern.
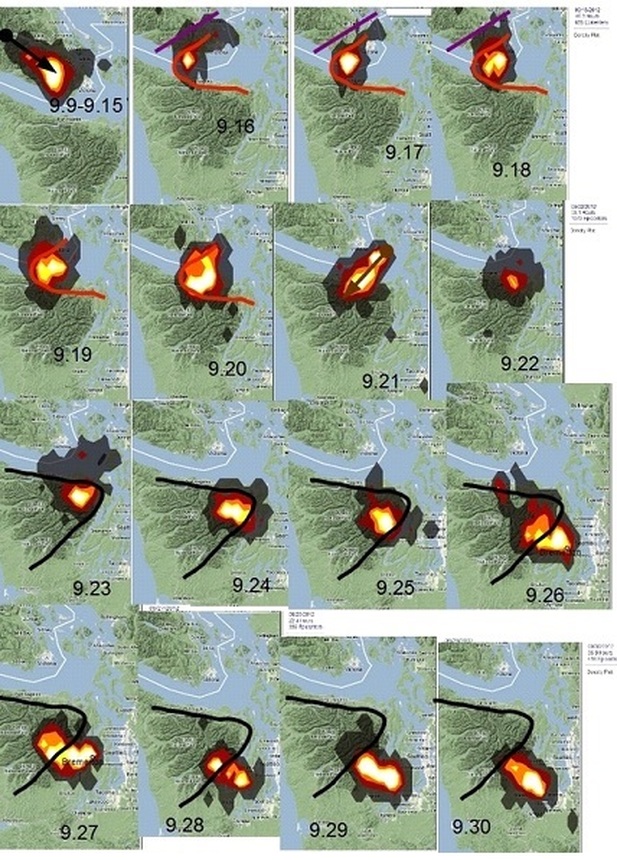
Figure 14b--Characteristics of tremor pattern of Sept. 2012 as the activity progressed around the nose of the JDFP arch (outlined by bold black line). The red line for 9.19 and 9.20 shows the nose of a mafic complex mapped in the seismic tomography (Stanley et al. 1999)
If dense tremor patterns such as those in Fig. 13 are inspected, the pattern seems somewhat repeatable to other Fall episodes, and with a connection to the 'transfer zone' in many cases. A closer inspection reveals a detailed connection to mapped geologic features. Figs. 14a,b employ tighter time windows for the tremor than that of Fig. 13g and outlines a very diagnostic pattern of tremor as the activity circles clockwise around the nose of the JDFP arch, shown by the black line in Fig. 14b. The red line in Fig. 14b is the tomographically mapped thickest part of the mafic complex between Vancouver Island and the Olympic Mts. region of Washington. As the tremor pattern moves to the end of Vancouver Island from the central part of the island, it lingers around the thick mafic unit shown by the red line for five days. This thick mafic units lies between the north side of the Olympic Peninsula and Vancouver Island as shown in the magnetic data of Fig. 12, but the core is defined better in the tomographic image of Fig. 14c below. Then it starts moving to the nose of the JDFP arch and tries to creep updip as has the tremor pattern for several years, including the pattern shown in Fig. 11c reproduced from Aguiar et al. (2009). The creep in tremor continues for five days until it localizes very tightly on the 'transfer zone' (Lamb et al., 2011) at the west end of the Seattle fault where it intersects the JDFP arch. On 9.28 the transfer zone activity starts to shift to the Tacoma area and southward, seemingly to follow the exact details of geology as outlined in the tomography and magnetic data. Analysis of such clearly diagnostic tremor patterns are missing from other studies of the tremor, as in Brudzinski et al. (2007, 2009), and Creager et al. (2010). However the detailed analysis by Ghosh et al. (2010) points out the clear role of the JDFP arch axis in localizing tremor and slip during one episode in 2008. In an extension of their earlier analysis Ghosh et al. (2012) focus on tremor events along the well-defined JDFP arch axis (as we interpret from our tomographic images). They demonstrated how such geometry localizes day to day slip and they outline a model involving fluid flow/patch models which seem to be valid for the regularized geometry of the JDFP arch.
If dense tremor patterns such as those in Fig. 13 are inspected, the pattern seems somewhat repeatable to other Fall episodes, and with a connection to the 'transfer zone' in many cases. A closer inspection reveals a detailed connection to mapped geologic features. Figs. 14a,b employ tighter time windows for the tremor than that of Fig. 13g and outlines a very diagnostic pattern of tremor as the activity circles clockwise around the nose of the JDFP arch, shown by the black line in Fig. 14b. The red line in Fig. 14b is the tomographically mapped thickest part of the mafic complex between Vancouver Island and the Olympic Mts. region of Washington. As the tremor pattern moves to the end of Vancouver Island from the central part of the island, it lingers around the thick mafic unit shown by the red line for five days. This thick mafic units lies between the north side of the Olympic Peninsula and Vancouver Island as shown in the magnetic data of Fig. 12, but the core is defined better in the tomographic image of Fig. 14c below. Then it starts moving to the nose of the JDFP arch and tries to creep updip as has the tremor pattern for several years, including the pattern shown in Fig. 11c reproduced from Aguiar et al. (2009). The creep in tremor continues for five days until it localizes very tightly on the 'transfer zone' (Lamb et al., 2011) at the west end of the Seattle fault where it intersects the JDFP arch. On 9.28 the transfer zone activity starts to shift to the Tacoma area and southward, seemingly to follow the exact details of geology as outlined in the tomography and magnetic data. Analysis of such clearly diagnostic tremor patterns are missing from other studies of the tremor, as in Brudzinski et al. (2007, 2009), and Creager et al. (2010). However the detailed analysis by Ghosh et al. (2010) points out the clear role of the JDFP arch axis in localizing tremor and slip during one episode in 2008. In an extension of their earlier analysis Ghosh et al. (2012) focus on tremor events along the well-defined JDFP arch axis (as we interpret from our tomographic images). They demonstrated how such geometry localizes day to day slip and they outline a model involving fluid flow/patch models which seem to be valid for the regularized geometry of the JDFP arch.
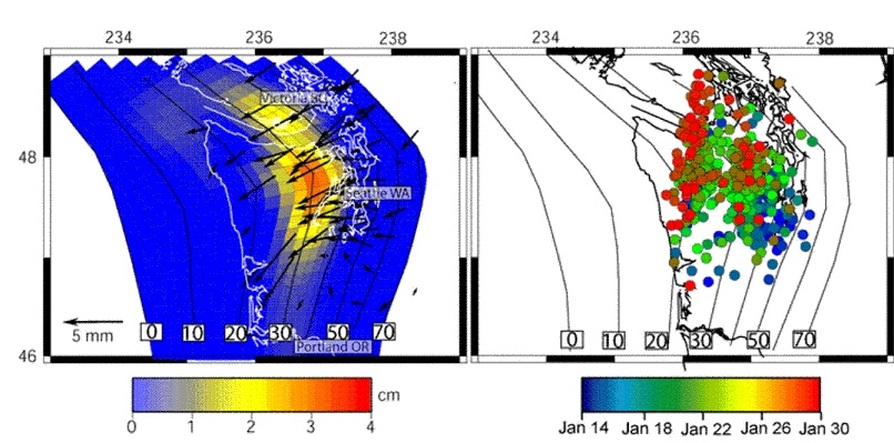
Figure 14c--JDFP arch slip and tremor from Aguiar et al. 2009 showing the GPS documented backslip updip along the JDFP arch on the left and the associated tremor pattern on the right.
The typical pattern of GPS measured backslip and episodic tremor in the JDFP arch region is illustrated very well in the Jan. 2007 episode of Fig. 14c. The color coding scale for the measured slip vectors represents inversion to provide thrust faulting for the overall vector set. The tremor for this area started on Jan. 14 in the Seattle transfer zone primarily, but as typical jumped northward to the axis of the arch and then updip, but rotating CCW around to southern Vancouver Island. This pattern for 2007 repeats a rather consistent focus for tremor and slip near the nose of the JDFP arch for the whole period 1998-2008 as plotted by Schmidt and Gao (2010) in Fig. 14d below.
The typical pattern of GPS measured backslip and episodic tremor in the JDFP arch region is illustrated very well in the Jan. 2007 episode of Fig. 14c. The color coding scale for the measured slip vectors represents inversion to provide thrust faulting for the overall vector set. The tremor for this area started on Jan. 14 in the Seattle transfer zone primarily, but as typical jumped northward to the axis of the arch and then updip, but rotating CCW around to southern Vancouver Island. This pattern for 2007 repeats a rather consistent focus for tremor and slip near the nose of the JDFP arch for the whole period 1998-2008 as plotted by Schmidt and Gao (2010) in Fig. 14d below.
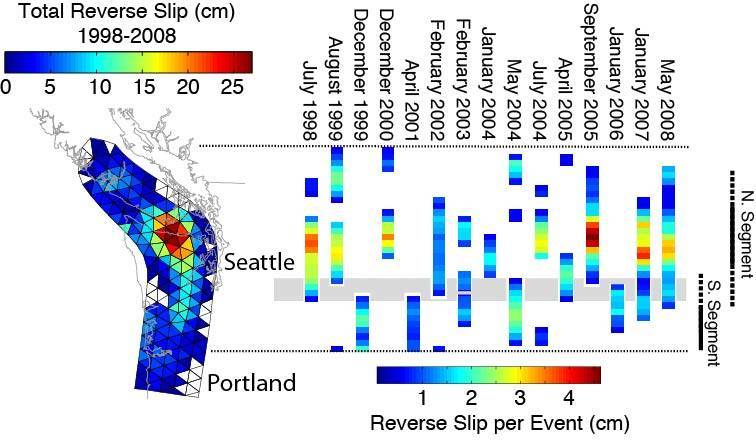
Figure 14d--Integrated slow slip data gridded in finite element grid by Schmidt and Gao (2010).
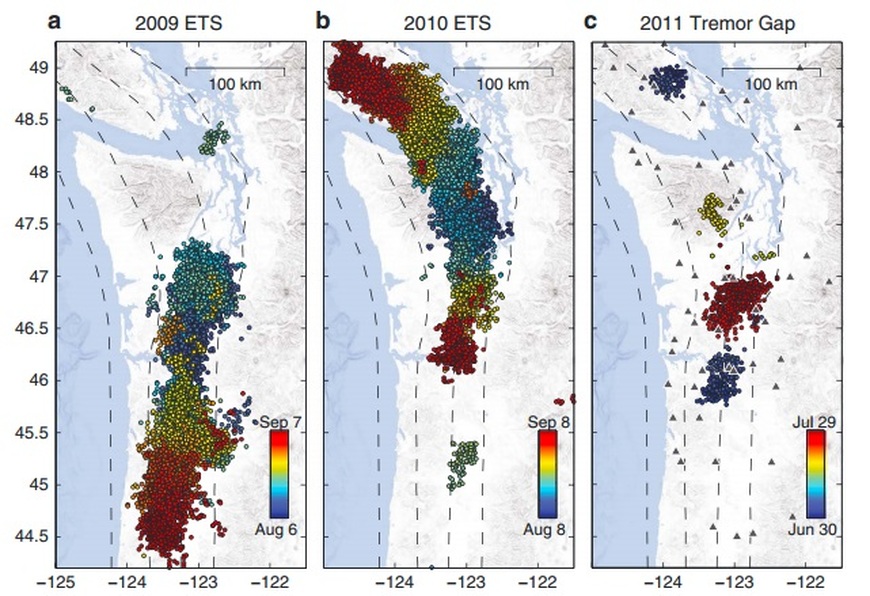
Figure 14e-Illustration from Wech and Bartlow (2014) showing 2009, 2010, and 2011 tremor episodes for their interpretive dates.
The analysis by Wech and Bartlow (2014) using data reproduced in Figure 14e follows the earlier study of Bartlow et al. (2011) which focused on relationships between GPS measured slip and the temporal episodic tremor. Bartlow et al. concluded that:
'Despite the clear association of tremor and slip the physical relationship between them is unresolved. Tremor appears to result from slip on small asperities on the plate interface due to either creep on the surrounding fault, or stress increases ahead of the propagating slow-slip front. Previous studies of migrating slow slip events have not had sufficient spatial and temporal resolution to differentiate between these two models.'
Wech and Bartlow (2014) further refined the connection between tremor and slip and concluded that they observed for the first time:
'a large, tremor-generating slow earthquake change from tremor-genic to silent and back again. The tremor falls silent at reduced slip speeds when the migrating slip front pauses as it loads the stronger adjacent fault segment to failure. The finding suggests that rheology and slip-speed-regulated stressing rate control tremor genesis, and the same section of fault can slip both with and without detectable tremor, limiting tremor’s use as a proxy for slip.'
What neither of these authors and their associates recognize is the clear connection of tremor patterns and sometimes associated slip with known geologic structures such as the core of Siletzia in the coast range of Oregon, the tight curvature both vertically and horizontally of the nose of the arch in the JDFP, and the role of the core of Wrangellia under Vancouver Island. Smaller features such of the Black Hills piece of Siletzia south of Olympia and other similar features make very repeatable and diagnostic patterns of tremor an example of which follows in Fig. 15a below.
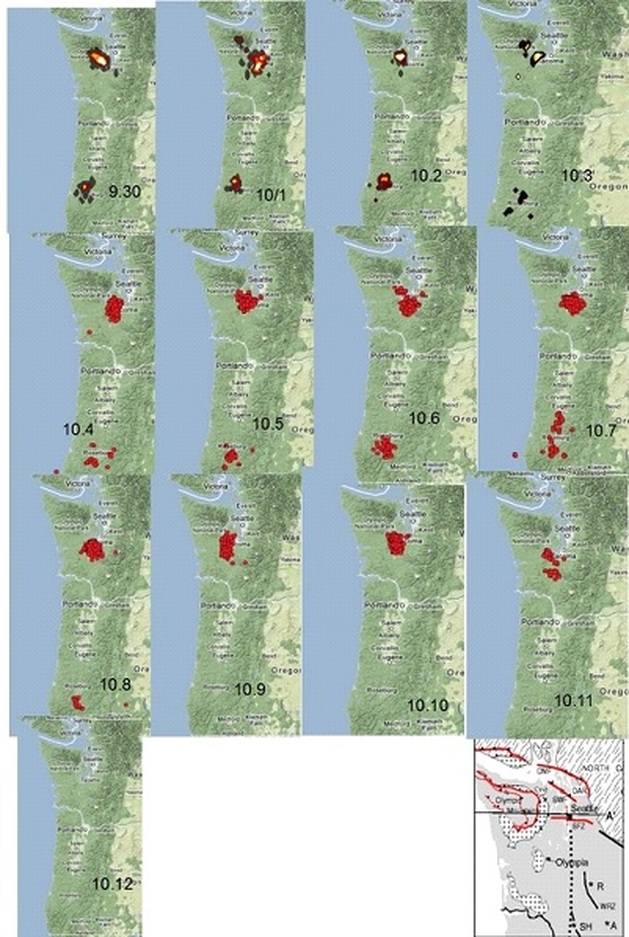
Figure 15a--Tremor patterns for 2012 event around the JDFP arch continued from Fig. 11a between 9.30 and 10.12.
An interesting phenomenon in several Washington-VI (Vancouver Island) tremor events is shown in Fig. 15. The tremor pattern shown in Fig. 15a continues to the southeast off of the JDFP arch until it reaches the Black Hills mafic block area (see the cross-section in Fig. 6b)where is localizes for 11 days until 10.11. The Black Hills mafic block was noted by Stanley et al. (1999) to be an isolated section of Siletzia which is underlain by Tertiary sedimentary rocks like, or connected to, similar rocks in the Olympic Mts (see Fig. 15b NS VpVs section below). It seems that this unit is in a key position between the strain regime under the JDFP arch region and that of the northern end of the mafic core of Siletzia which extends southward into central Oregon. As one moves north from the Black Hills, the blocks of mafic crust become broader and more in contact with the subducting JDFP, and going southward the blocks are more unified, especially south of the Portland area. It would seem that the tremor associated with the Black Hills is likely coming from depths of 15-25 km where the mafic rocks overly sedimentary rocks as suggested by the NS Vp/Vs velocity section of Fig. 15b just below. The gravity/magnetic data of Fig. 15c outlines the Black Hills area more clearly for coincidence of tremor patterns such as those shown in later figures.
An interesting phenomenon in several Washington-VI (Vancouver Island) tremor events is shown in Fig. 15. The tremor pattern shown in Fig. 15a continues to the southeast off of the JDFP arch until it reaches the Black Hills mafic block area (see the cross-section in Fig. 6b)where is localizes for 11 days until 10.11. The Black Hills mafic block was noted by Stanley et al. (1999) to be an isolated section of Siletzia which is underlain by Tertiary sedimentary rocks like, or connected to, similar rocks in the Olympic Mts (see Fig. 15b NS VpVs section below). It seems that this unit is in a key position between the strain regime under the JDFP arch region and that of the northern end of the mafic core of Siletzia which extends southward into central Oregon. As one moves north from the Black Hills, the blocks of mafic crust become broader and more in contact with the subducting JDFP, and going southward the blocks are more unified, especially south of the Portland area. It would seem that the tremor associated with the Black Hills is likely coming from depths of 15-25 km where the mafic rocks overly sedimentary rocks as suggested by the NS Vp/Vs velocity section of Fig. 15b just below. The gravity/magnetic data of Fig. 15c outlines the Black Hills area more clearly for coincidence of tremor patterns such as those shown in later figures.
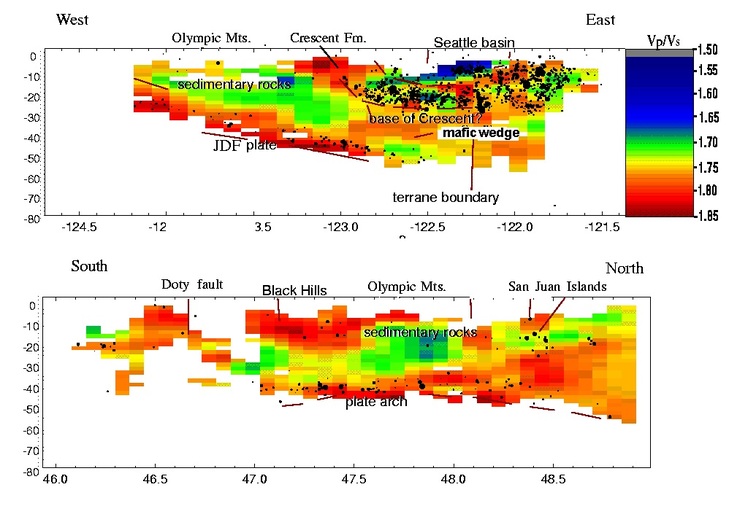
Figure 15b--Vp/Vs cross sections from seismic tomography results of Stanley et al. (1999).
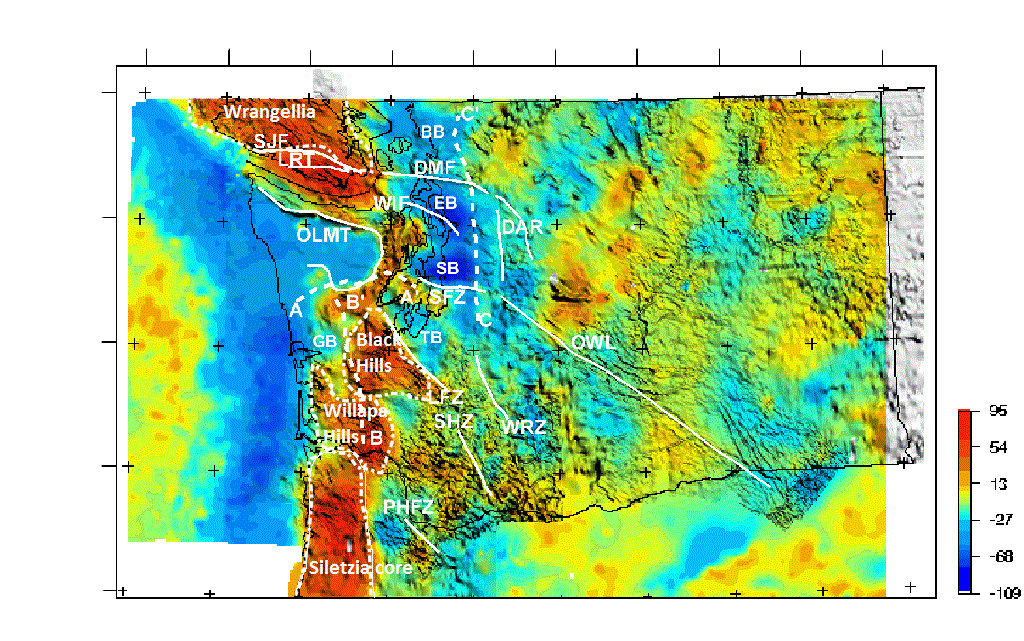
Figure 15c--Combined magnetic and gravity map of Washington and northern Oregon with southern Vancouver Island from Finn et al. (1990). Major fault zones are noted by white lettering and the Olympic Wallowa Lineament from Raisz (1945) also indicated but refuted in this publication. SJF=San Juan Island fault, LRT=Leech River thrust, DMF=Devils Mt fault (DDMF elsewhere in this report), OLMT=Olympic Mt terrane, WRZ=western Rainier zone, SHZ=St. Helens zone, EB=Everett Basin, SB=Seattle Basin, TB=Tacoma Basin, PHFZ=Portland Hills fault zone,
DAR=Darrington fault.
DAR=Darrington fault.
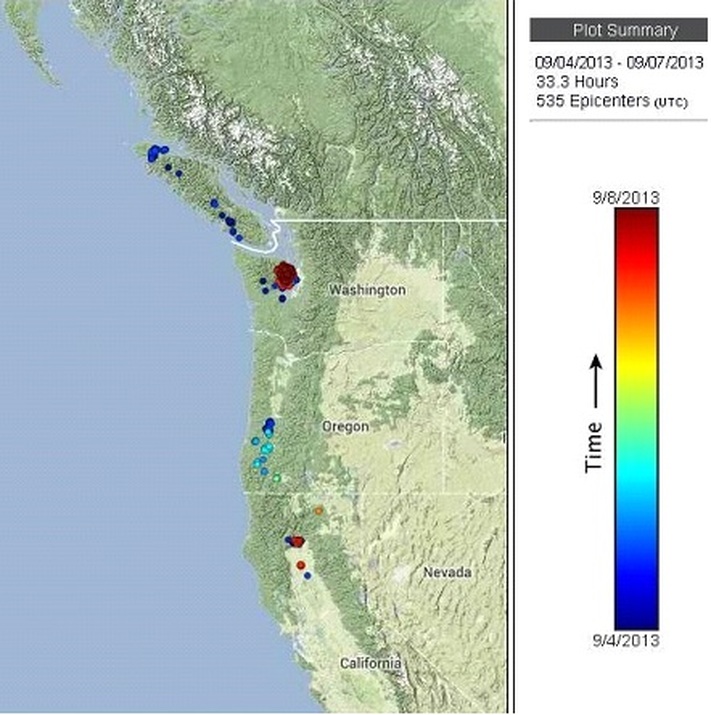
Figure 16--Early days of 2013 tremor episode which largely occurred during September and was over by Oct. 8.
The tremor episode for 2013 apparently had an earlier startup and lacked some of the intensity of other episodes. However, the initiation of this episode seems to be particularly diagnostic as shown in Fig. 16. The tremor episode began with minor recorded tremor all up and down the subduction zone interface but then localized in a relatively intense pattern associated with the transfer zone at the west end of the Seattle fault. This data and other episodes suggest that the complexity of the JDFP arch area, including the gap between mafic blocks on either side of the Seattle basin (and forming it), the transfer zone at the west end of the Seattle fault, and other details such as the magnetic ridge shown on the arch control the high tremor activity in the region. Does this mean that the diagnostic signal for an upcoming major subduction earthquake will originate in this area? Not necessarily, for the higher level of stress located at the subduction interface in the steeper part of the interface under central Oregon may mean that this zone could tremor/slip and move rapidly toward the projected M9 (or M8, M8.5, etc.) event in very short order totally outside any repetitive interval timing for the ETS episodes observed in the short decade (2003-2013) they have been mapped.
The tremor episode for 2013 apparently had an earlier startup and lacked some of the intensity of other episodes. However, the initiation of this episode seems to be particularly diagnostic as shown in Fig. 16. The tremor episode began with minor recorded tremor all up and down the subduction zone interface but then localized in a relatively intense pattern associated with the transfer zone at the west end of the Seattle fault. This data and other episodes suggest that the complexity of the JDFP arch area, including the gap between mafic blocks on either side of the Seattle basin (and forming it), the transfer zone at the west end of the Seattle fault, and other details such as the magnetic ridge shown on the arch control the high tremor activity in the region. Does this mean that the diagnostic signal for an upcoming major subduction earthquake will originate in this area? Not necessarily, for the higher level of stress located at the subduction interface in the steeper part of the interface under central Oregon may mean that this zone could tremor/slip and move rapidly toward the projected M9 (or M8, M8.5, etc.) event in very short order totally outside any repetitive interval timing for the ETS episodes observed in the short decade (2003-2013) they have been mapped.
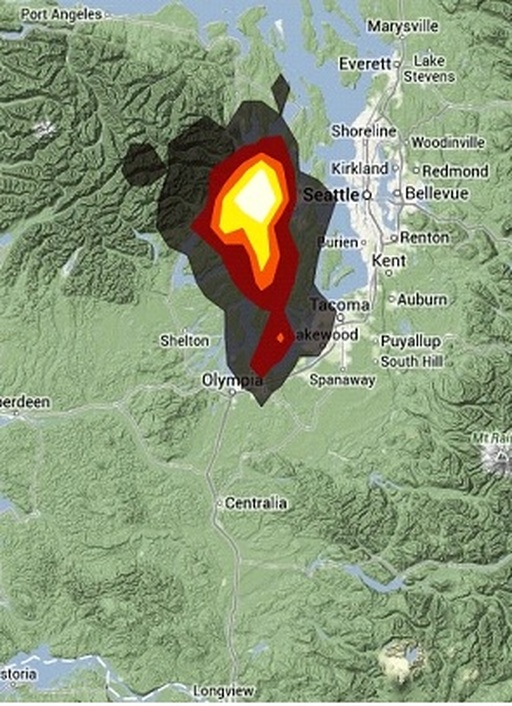
Figure 17a--The activity image for tremor on 9/8/13 shown in the larger map of Fig. 16.
Figure 17a merely clarifies the tremor pattern shown by the red dots in Fig. 16 near Seattle which generally starts near the west end of the Seattle fault and then migrates to the south toward Olympia and the Black Hills.
Figure 17a merely clarifies the tremor pattern shown by the red dots in Fig. 16 near Seattle which generally starts near the west end of the Seattle fault and then migrates to the south toward Olympia and the Black Hills.
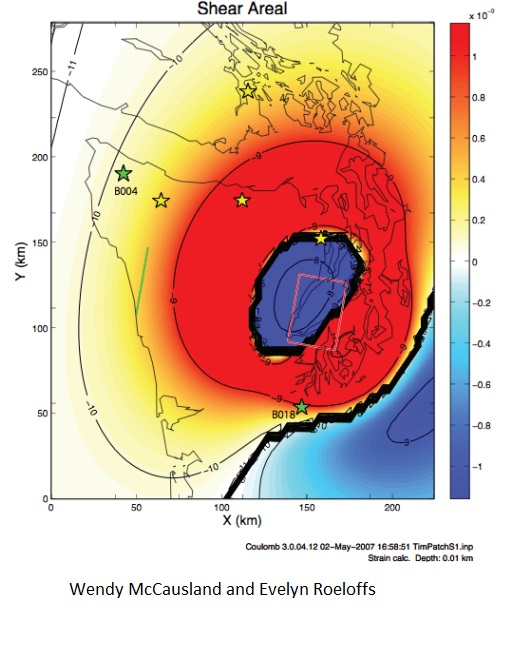
Figure 17b--Strain data for January, 2007 during tremor episode from McCausland and Roeloffs (2007).
The only data from a dozen or so strainmeters emplaced in boreholes in the Olympic Peninsula region that has been published is depicted in the model of Fig. 17b, which used only two of the most reliable instruments at the time (2007). Meager though the data is, it seems to support the interpretation that the 'transfer zone' and edge of the mafic block between the SFZ and TFZ is very unstable.
The only data from a dozen or so strainmeters emplaced in boreholes in the Olympic Peninsula region that has been published is depicted in the model of Fig. 17b, which used only two of the most reliable instruments at the time (2007). Meager though the data is, it seems to support the interpretation that the 'transfer zone' and edge of the mafic block between the SFZ and TFZ is very unstable.
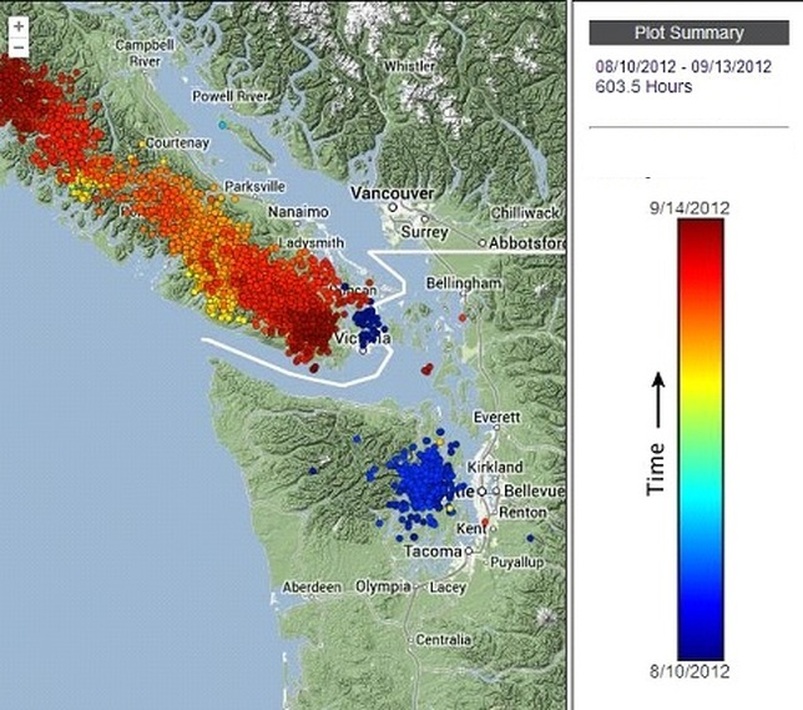
Figure 18a--Tremor activity for the 2012 events from 8/10 to 9/13.
The role of the unstable transfer region at the west end of the Seattle fault zone in tremor initiation is illustrated again by the tremor plot in Fig. 18a. The very localized tremor in this unstable transfer zone immediately jumps to southern Vancouver Island and expands to encompass most of Wrangellia. A small amount of motion on the narrow zone at the intersection of the 'gap' and the JDFP arch seems to often trigger broader tremor and slip episodes. Alternately the regional slip field from the subduction interface starts to slowly cause motion back updip, with the result that the transfer zone is a sensor predicting broader tremor patterns.
The role of the unstable transfer region at the west end of the Seattle fault zone in tremor initiation is illustrated again by the tremor plot in Fig. 18a. The very localized tremor in this unstable transfer zone immediately jumps to southern Vancouver Island and expands to encompass most of Wrangellia. A small amount of motion on the narrow zone at the intersection of the 'gap' and the JDFP arch seems to often trigger broader tremor and slip episodes. Alternately the regional slip field from the subduction interface starts to slowly cause motion back updip, with the result that the transfer zone is a sensor predicting broader tremor patterns.
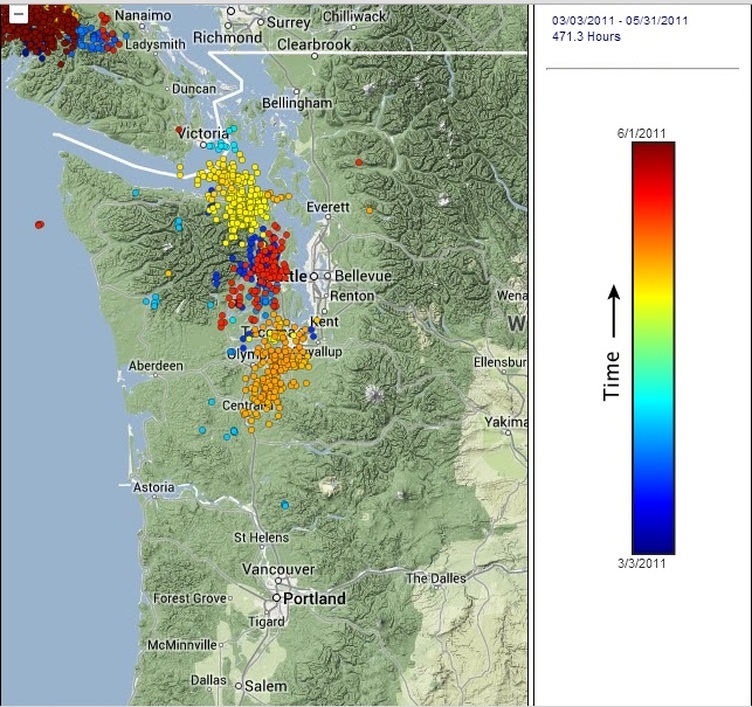
Figure 18b--Tremor patterns for 3/3/2011 to 5/1/2011
The figure just above shows that the transfer zone area can both start and end tremor patterns. This tremor pattern is a 'Spring' pattern and possibly controlled by tidal excursions as suggested by some authors (Thomas et al., 2013) for main episodes in 2010 and 2011. The tremor pattern for this two month period in the spring during high tidal force transitions started in the transfer zone (blue dots) and ends there (red dots). In addition to the moon/sun tidal forces during this period, the March-April period in the Cascadia region is one of maximum rainfall and ground water saturation. It appears to us that the involvement of tidal forces with the tremor cycle involves the Spring pattern which starts as the tidal forces start to decline sharply after a yearly maximum as shown in Fig. 18c below. Then as the tidal forces start their rise again in the Fall, the main tremor episodes are triggered. Because of the yearly variations in these transitions, the tremor periodicity also varies, illustrated by the early cycle in 2013. Regardless of relationship to tidal forces, the transfer zone can be thought of as the most sensitive meter of stress in the Olympic Peninsula portion of the subduction interface. And although there is apparently a relationship to timing of some aspects of the tremor patterns as discussed by Thomas et al. (2013) and other recent publications referenced in their most recent summary, the most obvious importance of the tremor patterns (and slip) is the detailed illumination of deep geologic details and these details in connection with possible megaquake prediction. This connection more strongly to geology rather than tidal forces is illustrated in Fig. 18c below copied from Thomas et al. The two tremor patterns in red for 2010 and 2011 (Aug. 16-17) can be somewhat keyed to tidal forces as shown in Fig. 18d, but the remarkable feature is that the two highly repeatable patterns are clearly due to the details of the JDFP arch nose as shown in the tomographic image of Fig. 5. The remarkable similarity of the two yearly tremor patches is not due to similarity in tidal forces, but to the subsurface details of the most tightly folded nose of the JDFP arch. In Fig. 18d just below Thomas et al. (2011) does show that RTR (rapid tremor reversals) occur somewhat in synchrony with tidal peaks, but this is much less significant than the overall tremor pattern densities that are repeatable over successive years directly connected to well mapped geologic structures. More illustrations of this tight control of geologic features over tremor migration patterns than discussed above are surveyed in the lengthy analysis of yearly tremor patterns on the informal web site http://www.cascadiageophysics.com.
The figure just above shows that the transfer zone area can both start and end tremor patterns. This tremor pattern is a 'Spring' pattern and possibly controlled by tidal excursions as suggested by some authors (Thomas et al., 2013) for main episodes in 2010 and 2011. The tremor pattern for this two month period in the spring during high tidal force transitions started in the transfer zone (blue dots) and ends there (red dots). In addition to the moon/sun tidal forces during this period, the March-April period in the Cascadia region is one of maximum rainfall and ground water saturation. It appears to us that the involvement of tidal forces with the tremor cycle involves the Spring pattern which starts as the tidal forces start to decline sharply after a yearly maximum as shown in Fig. 18c below. Then as the tidal forces start their rise again in the Fall, the main tremor episodes are triggered. Because of the yearly variations in these transitions, the tremor periodicity also varies, illustrated by the early cycle in 2013. Regardless of relationship to tidal forces, the transfer zone can be thought of as the most sensitive meter of stress in the Olympic Peninsula portion of the subduction interface. And although there is apparently a relationship to timing of some aspects of the tremor patterns as discussed by Thomas et al. (2013) and other recent publications referenced in their most recent summary, the most obvious importance of the tremor patterns (and slip) is the detailed illumination of deep geologic details and these details in connection with possible megaquake prediction. This connection more strongly to geology rather than tidal forces is illustrated in Fig. 18c below copied from Thomas et al. The two tremor patterns in red for 2010 and 2011 (Aug. 16-17) can be somewhat keyed to tidal forces as shown in Fig. 18d, but the remarkable feature is that the two highly repeatable patterns are clearly due to the details of the JDFP arch nose as shown in the tomographic image of Fig. 5. The remarkable similarity of the two yearly tremor patches is not due to similarity in tidal forces, but to the subsurface details of the most tightly folded nose of the JDFP arch. In Fig. 18d just below Thomas et al. (2011) does show that RTR (rapid tremor reversals) occur somewhat in synchrony with tidal peaks, but this is much less significant than the overall tremor pattern densities that are repeatable over successive years directly connected to well mapped geologic structures. More illustrations of this tight control of geologic features over tremor migration patterns than discussed above are surveyed in the lengthy analysis of yearly tremor patterns on the informal web site http://www.cascadiageophysics.com.
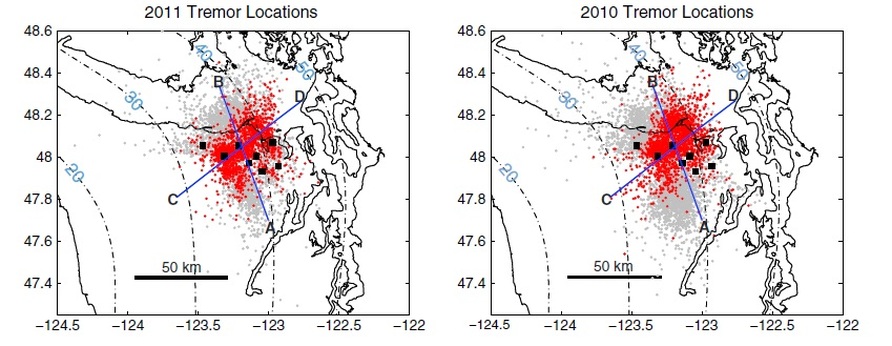
Figure 18c--Map of tremor epicenters used by Thomas et al. (2013) in their study of tidal influences. Red dots are tremor locations for Aug. 16-19 2010 and 2011. Gray dots are data 6 days before and 6 days afterwards. CD is downdip line for distance scale in Fig. 18d (color scaled on right side of 18d) and tremor events projected on panel at line AB.
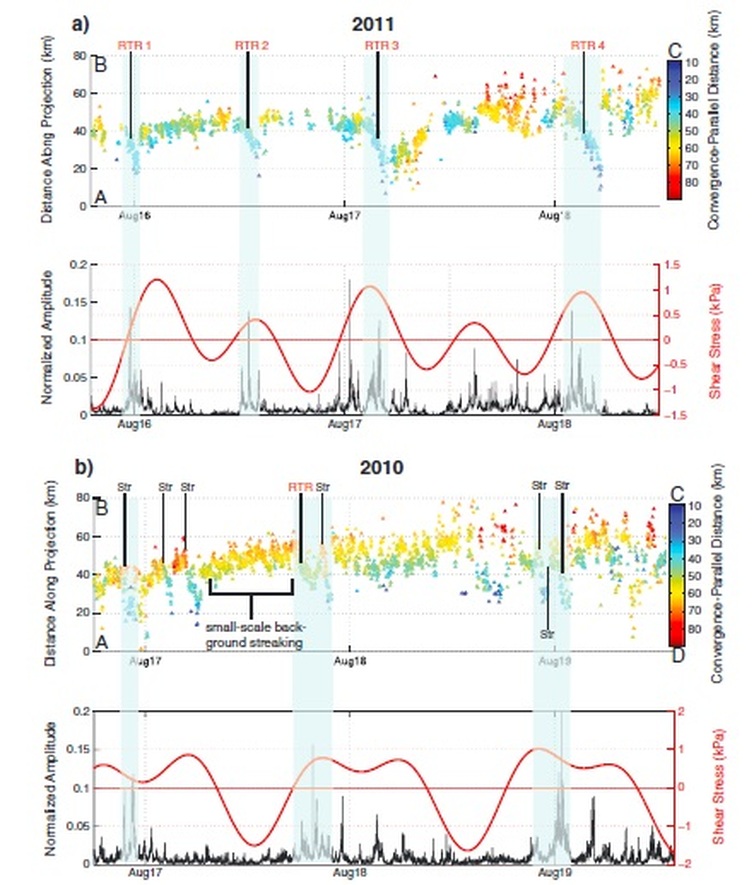
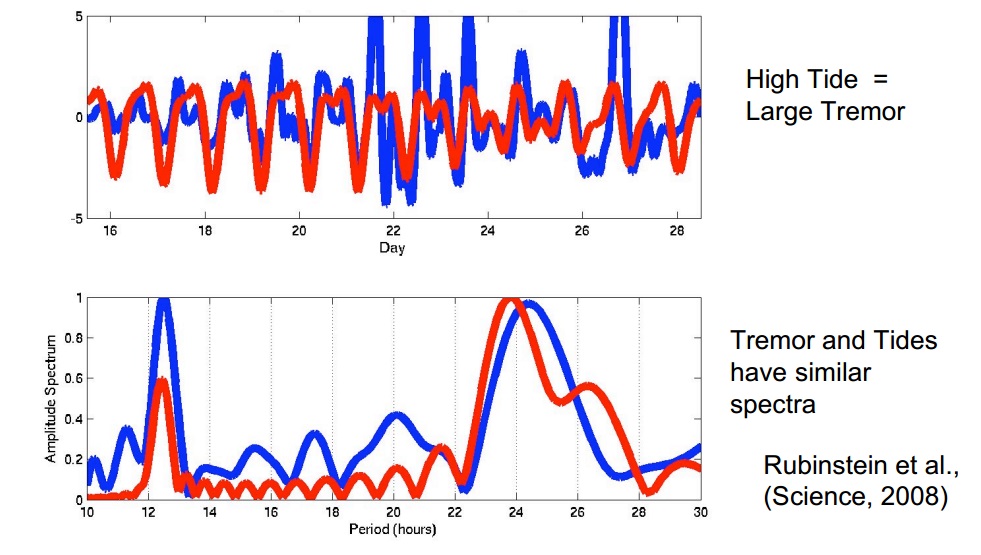
Figure 18d--(upper)raw tidal and tremor data from Thomas et al. (2013). Red curves are tidal excursions. RTRs are rapid tremor reversals (updip or downdip change) in the overall short term tremor intervals. (lower)tremor and tide comparison for 2007 tremor episodes from Rubenstein et al. (2008).
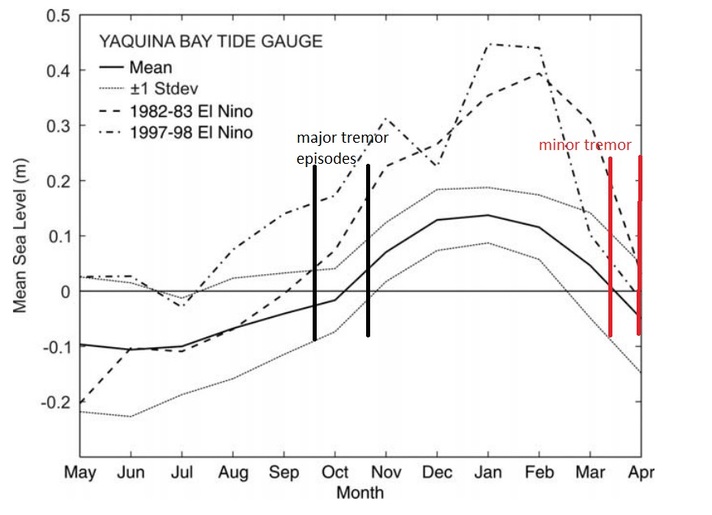
Figure 18e--Typical tidal variations at Yaquina Bay from Komar et al. (2011).
Other authors have made the point that tidal forces are not the controlling factor of the location of longer term tremor episodes (more than a few days), but are mainly are reflection of subduction zone inhomogeneities and stress directions and provide short term control. As noted by Rubenstein et al. (2008):
"In each episode, we saw clear pulsing of tremor activity with periods of 12.4 and 24 to 25 hours, the same as the principal lunar and lunisolar tides. This indicates that the small stresses associated with the solid-earth and ocean tides influence the genesis of tremor much more effectively than they do the genesis of normal earthquakes. Because the lithostatic stresses are five orders of magnitude larger than those associated with the tides, we argue that tremor occurs on very weak faults."
Ide (2011) interprets that tremor episodes in short intervals may be triggered by tidal cycles, but that longer episodes which form the focus of much analysis are related to properties of the interface and overlying structure. He states:
'The control property may be the ratio of brittle to ductile areas, perhaps determined by the influence of mantle wedge serpentinization on the plate interface. The spatial variation of the controlling property seems to be characterized by striations in tremor source distribution, which follows either the current or previous plate subduction directions. This suggests that the striations and corresponding interface properties are formed through the subduction of inhomogeneous structure, such as seamounts, for periods as long as ten million years.'
In the case of Cascadia we make the strong case that the variations in tremor patches are directly related to structure of the JDFP arch and nature of overlying lower crustal geologic entities. For instance, the tight nose of the JDFP plate arch in the NE part of the Olympic Peninsula appears to be a hinge point which tremor rotates around and much of the detailed analysis by other authors have focused on this area (Ghosh et al., 2009; 2010). This hinge point controls the migration of tremor north to Wrangellia under Vancouver Island which often hosts a strong tremor episode at the beginning or end of a yearly cycle. South of the JDFP arch nose the 'tremor zone' at the west end of the Seattle fault often either begins or ends a tremor episode and appears to be a valid stress signal generator. And the NW corner of the mafic block which forms the south side of the Seattle fault (and north side of Tacoma fault, Fig. 11) is also a strong focal point during the beginning or end of a tremor episode (Fig. 14a,b).
The question of the episodic tremor in the context of the overall subduction dynamics has to be argued from several viewpoints, but obviously new GPS data combined with mapped geological asperities and structures takes precedence over the rapidly developing data base of episodic tremor. The new GPS data combined with evidence for major subduction events from nearshore paleogeology studies is of prime importance. New understanding of the relationship of NS shortening to NE subduction zone slip is becoming available. For instance, Mazzotti et al. (2002) find the northern Washington segment of the Cascadia forearc can be divided into two regions based on the active deformation style and seismicity in the crust (which we discussed above). In the inner, Puget Lowland side of the convergence zone both intense crustal seismicity and active faults indicated very evident N-S shortening between ~46.5 and ~48.5 °N. The Olympic Mountains accretionary complex on the west side of the Puget Lowland was considered by them as an area where the main direction of long-term shortening has been debated. With more clarity from their new data, they interpreted from GPS strain rates and velocities that this region is currently shortening at ~3 ± 1 mm/yr in the N-S direction and at ~10 ± 1 mm/yr E-W, values which they feel are in good agreement with inference of N-S crustal shortening based on shallow earthquake data in the Puget Lowland. When they inferred that the subduction-related interseismic deformation is purely elastic, their GPS long-term velocity vectors showed N-S shortening at ~5 ± 1 mm/yr in the Puget Lowland and ~6.5 ± 1 mm/yr across the Olympic Mountains. They interpreted that most of the Oregon forearc NS motion is accommodated in this region and slip rates are much lower under Vancouver Island. Thus the Olympic Mountains and Puget Lowland region accommodates NS motion that is about one third to one half of what the subduction thrust downdip coupling motion is. And major adjustments/earthquakes in the Puget Lowland mafic crustal blocks, such as that which defines the Seattle fault zone occur at about 2 to 3 times longer time intervals of major subduction events. Possibly the SFZ event of 1100 BP allowed enough coupling stress relief that the large subduction thrust quake in 1700 AD did not trigger any mafic crustal block adjustments in the Puget Lowland. And the next large Seattle area crustal earthquake may be several hundred years in the future. This quick and dirty analysis does not address, of course, the earthquake hazards from intraplate events caused by bend fracturing of the JDFP such as the 2001 Nisqually M6.8 event or other larger quakes in the past 100 years.
The interval between subduction events in northern Cascadia has been also recently revisited by Atwater and Griggs (2012). They take a detailed look at offshore evidence and find that:
‘during the past 2,500 years, the Cascadia plate boundary may have broken more often offshore southern British Columbia and northern Washington than offshore southern Washington….. A greater frequency of far-northern plate-boundary earthquakes would help explain the roughly 300-year average interval between inferred tsunamis at Discovery Bay, northern Washington.’
Certainly the highly deformed nature of the western Washington forearc and coastal region that we and others have outlined would suggest rapid and frequent energy release fitting with the findings of Atwater and Griggs. But these may be smaller quakes than are generated when the central Oregon section of the subduction zone releases as it did in 1700 AD. Nevertheless a Washington margin and downdip subduction zone event would affect the mostly densely populated region of the Pacific Northwest and if coupled with another SFZ type event or a shear event on the SWIF, could add to the magnitude of destruction.
SUMMARY AND CONCLUSIONS
The subduction zone boundary and crustal features in Western Washington appear in important detail when various data sets are combined. The seismicity patterns and previously mapped faults provide a basic interpretive background for further understanding of the features needed to properly assess future earthquake hazards. Using the dense seismicity data to calculate gridded velocity patterns with seismic tomography techniques has been, and will be in the future, a basic means of understanding the lithology of crustal blocks and the geometry of the subducting Juan de Fuca plate. One key example of this utility is the mapping of the important arch structure of the JDFP under the Olympic Peninsula. A broader scale grid encompassing most of Washington state mapped the broader outline of mafic blocks that encircle the Puget Lowland region, as well as a key accretionary boundary along the margin of older accreted terranes of the North Cascades and the Columbia Plateau region covered by Eocene basalts.
The magnetic data discussed in this report have not been processed in any manner other than use of the basic files compiled in the National Magnetic Map. No filtering or reduction to pole were part of the study, but the raw data reveals many features significant to understanding the crust and JDFP. Patterns of magnetic lineaments in the Columbia Plateau region reveal a through going magnetic low that coincides with the tomographic feature extending from the area in which the SFZ, SWIF, DDMF, and RMFZ seem to intersect. We have called this aeromagnetic and tomographic feature the Yakima fold boundary (YFB). This YFB appears to represent the northern stress boundary between shallow folded Columbia River basalts and deep pre-Tertiary accreted terranes continuing to the North Cascades region. Where this feature intersects the junction of the eastern Seattle fault zone, the SWIF, DDMF, and RMFZ, dense seismicity occurs from shallow depths to the bottom of the crust as shown in area B of Figs. 3 and 4.
The western Seattle fault zone has been studied by Lamb et al. (2011) using a variety of methods, including marine seismic reflection profiling in the waterways. They defined a 'transfer zone' from surface geological studies that fits with interpretation that we make from our tomographic results and the magnetic data. The Seattle fault zone itself lies along the north edge of a block of mafic crust and the Seattle Basin is formed by structure between this block and one to the north, shown in the tomography as a velocity 'gap'. The tomographic results show that there is a structure trending off the main JDFP axis into the 'gap' and magnetic data show a distinct magnetic trend pointing right through the south side of the 'gap' and along the magnetic anomaly associated with the Seattle fault and extending all the way to junction with the other faults in area B (Fig. 3) of the seismicity patterns.
Episodic tremor patterns have repeated at 12-14 month intervals, but details of much of the source regions for these patterns have been poorly understood. The GPS backslip data aids in understanding the process behind these tremor patterns, but the tremor itself is most useful in understanding the nature of the geologic units which generate the episodic slip. We demonstrated that a key feature of the tremor patterns that occur in the northwestern Washington/Vancouver Island region is the JDFP arch, but perhaps more importantly is the 'signal' provided by the transfer region at the west end of the Seattle fault. It is our interpretation that the transfer region is located where the mafic block that forms the lineament defining the fault is in stressed contact with the south side of the JDFP arch. This is of importance to understanding the relationship of the 1100 BP earthquake assumed to have originated at the SFZ and possible linkage to a subduction zone event that occurred in northern Cascadia in about the same period (Nelson et al., 2006). We demonstrated that the highly unstable region at the west end of the Seattle fault in this 'transfer region' can spring into relatively intense tremor activity at the onset to broad minor tremor occurrences up and down the subduction interface. Connecting shortening rates using GPS, analysis of tremor patterns, and coordinating paleoseismic evidence for subduction events with somewhat stronger evidence for large crustal earthquakes are a clear path to understanding the overall hazards for Washington populated areas.
Our conclusions center around the need to investigate further details of the Seattle fault zone physical connections with the underlying subducting plate structure and the possible hazards to the highly populated region in the Puget Lowland from the SFZ and a large Cascadia event. Interpretation in Stanley et al. (1999) that a subduction zone event would involve slip beneath the Puget Lowland, rather than just offshore , has been echoed by other authors since and seems to be the accepted model for evaluating earthquake hazards from a subduction event. It is very important to increase our understanding of the episodic tremor and slip patterns to determine, if possible, the actual signatures that could signal a forthcoming large earthquake on the subduction zone or Seattle fault zone. The Cascadia region forms a unique laboratory in the world for making such predictive assessments and the US could possibly avoid the tragedy of scientific failure associated with the 2011 Tohoku event in Japan. The episodic tremor and slip data provided by the PANGA group and the interactive data sites designed by Aaron Wech while at the University of Washington mean that the data has been built up to a highly useful level and will continue to provide new information. For instance, the tremor activity in 2013 started as shown in Fig. 16 but in most researchers' view it started earlier than usual (assumed 12-14 mo. cycle) and with fewer events. The time interval of the historically observed ETS (episodic tremor and slip) is very small in geologic terms, so it is reasonable to expect that there will be major changes in the pattern. It is up to all those who have the skills and motivation to study such data and combine it with all other geophysical and geological data to hopefully provide a warning for future large earthquakes. For further details of the complex, but understandable tremor patterns, one can refer to the more inclusive data on the web site: 'http://cascadiageophysics.com'
CONTINUING TREMOR ACTIVITY
This addenda section will be used to add continuing tremor activity as it moves along in time. It will not be complete but just contain parcels of activity that repeat earlier patterns or have unusual character. For instance in June, 2014 the pattern of tremor shown below is associated with the tight nose of the JDFP arch defined by tomography and started around 6/12, jumped for a few hours to the nose of the mafic wedge just south of Vancouver Island and then to the Black Hills mafic block south of Olympia. This is a pattern that has repeated several times of the record years.
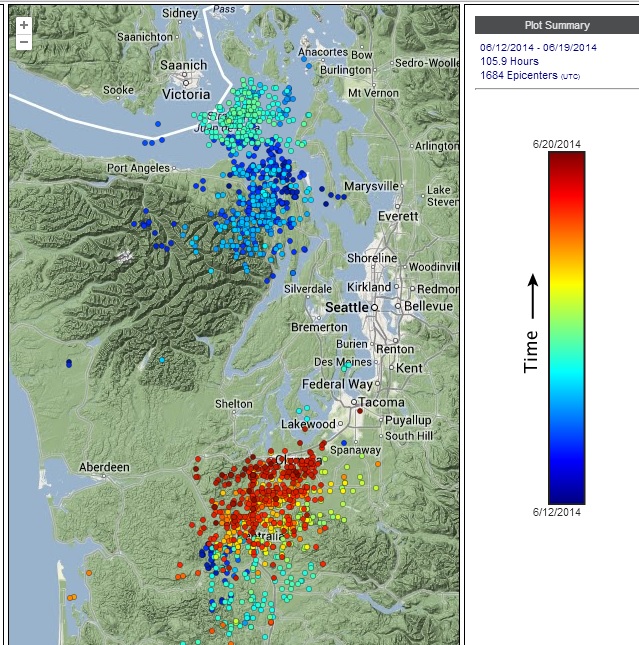
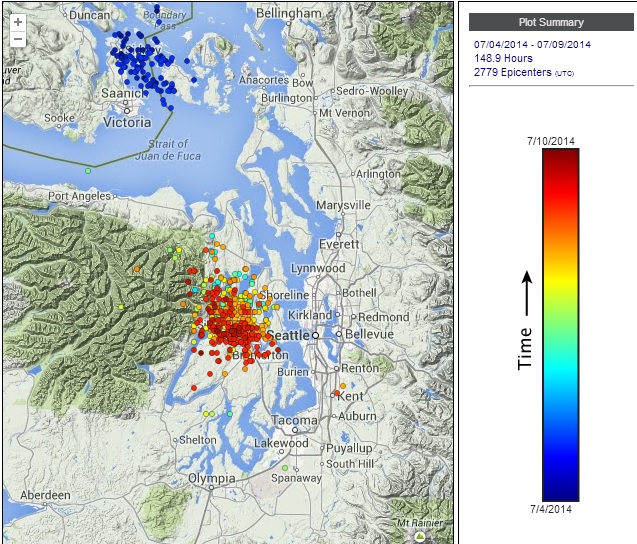
In the tremor sequence shown above from 7-4-2014 to 7-8-2014 the transfer zone is again illuminated with the activity starting on the north side of the 'gap' and migrating to the south side of the gap along the Seattle fault extension.
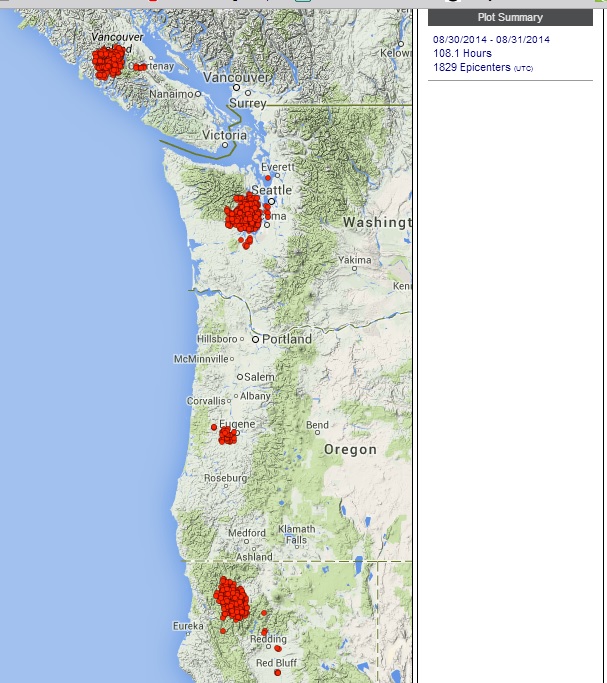
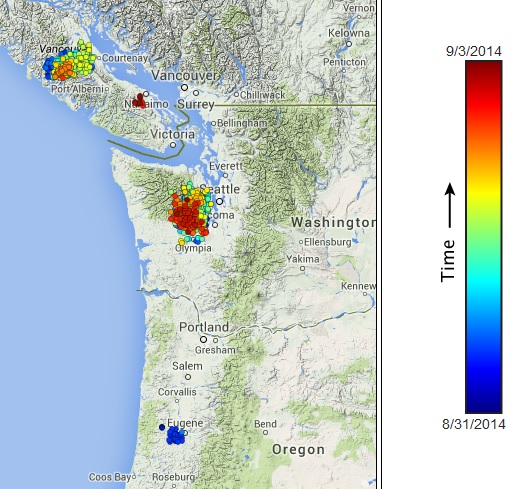
Two months later at the end of August (upper), two patches light up in northern California and central Vancouver Island, followed by the repeating patch west and SW of Seattle. We initially thought that this was probably the pattern that will be followed by the broader, yearly tremor pattern as observed in 2013.
But unlike 2013, the tremor only advanced to the area west of Tacoma as shown above (lower). After pausing and slightly moving from 8/31 to 9/03 it stopped and left only small patterns in northern California and mid Vancouver Island. Then there was noted some horizontal slip on the GPS station B018. This station in shown in Fig. 17c above. It is hard to rationalize how the tremor would stop during a horizontal slip episode, whereas in the past years the two events went together mostly. But it seems that the earthquake which happened (M4.0) on Sept. 17 provides some possible insight. It may be that even though there was coordinated tremor and slip for a few days, the horizontal motion at depths of about 20 km led to a normal earthquake of M4.0. The tremor and slip must have been occurring above the mafic complex that sits on top of the subducting plate and underneath basaltic rocks like those in the Crescent formation that overly the lower mafic complex. The figure just below shows the pattern of seismicity in this interface in the region between the Seattle and Tacoma faults, with the main concentration in the NW corner which is under the most stress due to NS motion of the blocks. The pattern of earthquakes at 18-20 km depth in this area can also be visualized on the cross section of Fig. 6d just above the 'mafic wedge'. The figure below reproduces the magnetic data (base illustration data is from Dept. of Natural Resources web site) in Fig. 11 with the M4 event location added. Rather than arguing that the M4 occurred on the Seattle fault zone, it is better geologically to point out that the event occurred in a contact zone between two mafic complexes outlined in Fig. 6d. This zone is always involved in a major tremor episode but in this instance the broad tremor pattern did not complete, but there was slip on the contact zone which generated a M4. quake.
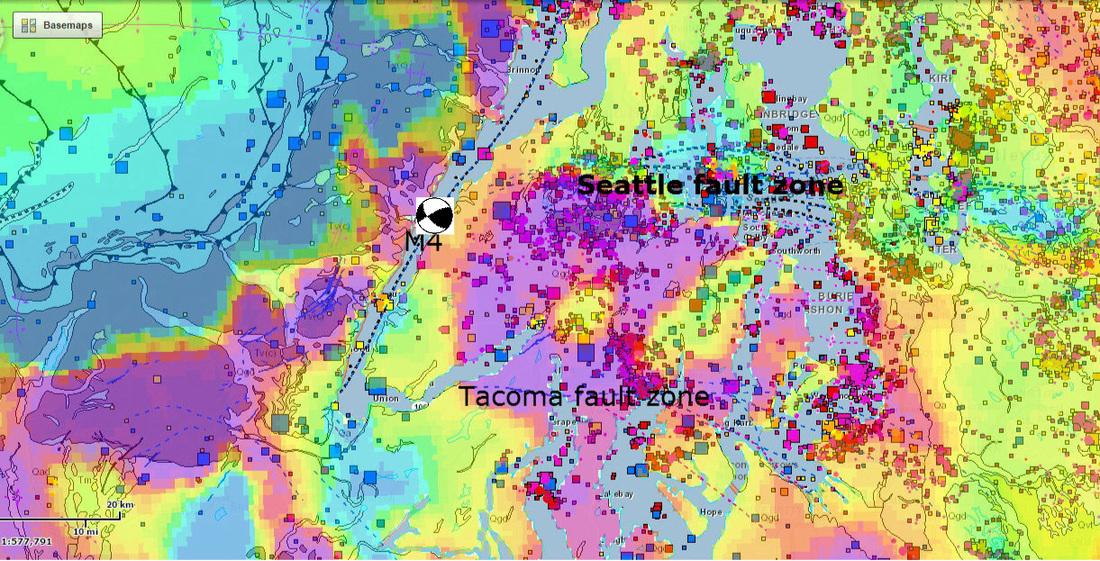
In the figure just below reproduced from Lamb et al. (2012) and in the data from the report, there is no clear evidence of the western extension of Seattle fault trace west of the Coho seismic line, but it is clear that a whole sequence of imbricated SE dipping faults curve around the curve of the mafic units that outcrop south of the Holly Road fault and where the numerous quakes shown above occur just south of the word Seattle. The M4 event of 9/17 occurred in the western end of the broad imbricated zone of the mafic rocks where it is contact with underlying more mafic rocks. These SE dipping faults penetrate down to a depth of about 20 km where the underlying mafic complex shown in the tomography results occurs. The focal mechanism shown in the figure above fits with this construction and does not mean that it isolates one strand of the Seattle fault.
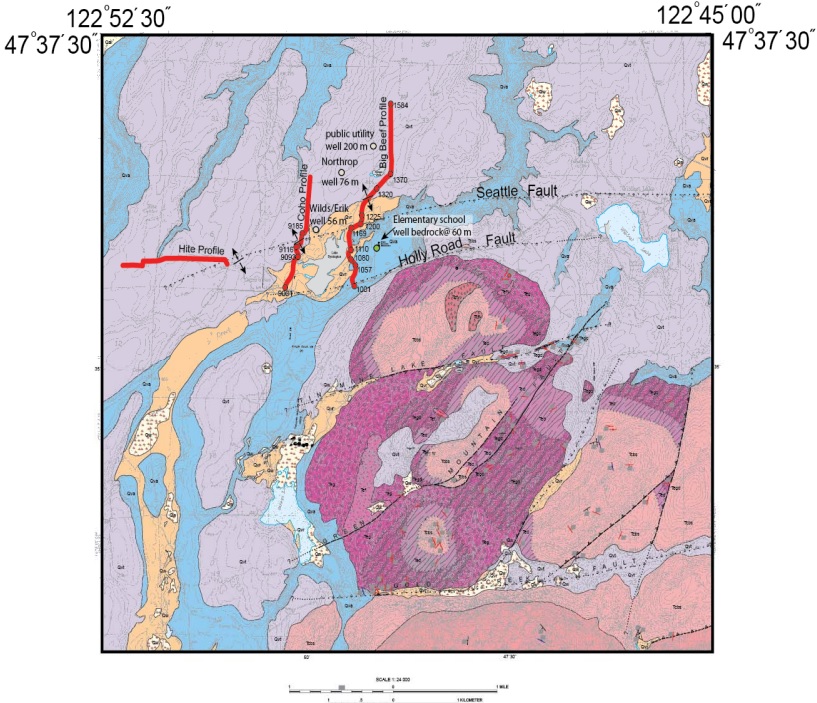
The illustration below was used in the Seattle Times article which quoted Craig Weaver and John Vidale who try to make the connection of the M4.0 with a westward extension of the Seattle fault, but the location doesn't match the drawn extension of the fault, which in itself is erroneous.
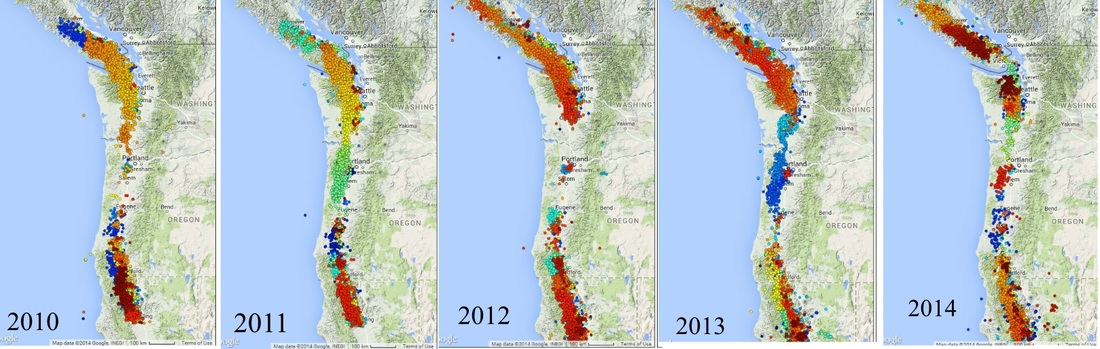
The figure above shows the year long tremor for 2010-2014. Although it is clear that this year (2014) and possibly last year there was some evolution in the tremor patterns, there realistically may not be any major changes in the tremor activity. For the short time interval where the best data is available, it is clear that there has been some changes year to year, but no more than would be expected in a complex subduction zone with complex asperities. If one looks at details of these asperities, such as those around the western Washington region, it surely can be determined that the tremor locally follows these asperities. But in terms of the overall activity of 37-55,000 tremor point detections there is probably nothing of significance. However, a detailed look at the pattern around the nose of the JDFP arch reflects a noticeable spottiness in 2014. So in spite of my comments on the pnsn discussion site about this year's tremor cycle (http://pnsn.org/blog/2014/11/18/canadian-ets-morphing-to-washington-one) I would certainly not like to jump to any 'conclusions'. Lets wait and see what 2015 brings! For anyone wanting to see the full discussion about the Fall 2014 tremor episodes, I have saved them here:
http://pnsntremor.weebly.com/
Extensive discussions of Cascadia details has been posted on PNSN.org/blog and on
http://disqus.com/home/channel/sci/discussion/channel-sci/earthquakes_and_episodic_tremor_in_the_pacific_northwest/
For interested parties they can also explore the series of topics listed below from pnsn.org/blog
http://pnsn.org/blog/2015/10/2...
http://pnsn.org/blog/2015/09/2...
http://pnsn.org/blog/2015/08/2...
http://pnsn.org/blog/2015/05/3...
http://pnsn.org/blog/2015/02/1...
http://pnsn.org/blog/2015/01/1...
http://pnsn.org/blog/2015/01/0...
http://pnsn.org/blog/2014/11/1...
http://pnsn.org/blog/2014/10/1...
http://pnsn.org/blog/2014/09/0...
http://pnsn.org/blog/2014/07/2...
http://pnsn.org/blog/2014/05/1...
REFERENCES
Aguiar, Ana C., Melbourne, T. I., and Scrivner, C. W., 2009, Moment release rate of Cascadia tremor constrained by GPS: Journal of Geophysical Res., v. 114, B00A05.
Atwater, B. F., 1992, Geologic evidence for earthquakes during the past 2000 years along the Copalis River, southern coastal Washington: Journal of Geophysical Research, 97, 1901-1919.
Atwater, B. F., and Hemphill-Haley, Eileen, 1997, Recurrence intervals for great earthquakes of the past 3500 years at northeastern Willapa Bay, Washington: U. S. Geological Survey Professional Paper 1576.
Atwater, Brian F. and Gary B. Griggs, 2012, Deep-Sea Turbidites as Guides to Holocene Earthquake History at the Cascadia Subduction Zone, Alternative Views for a Seismic-Hazard Workshop : Open-File Report 2012–1043.
Audet, Pascal, Bostock, M. G., Boyarko, D. C., Brudzinski, M. R., and Allen, R. M., 2010, Slab morphology in the Cascadia fore arc and its relation to episode tremor and slip: Journal of Geophysical Res., v. 115, B00A16, 15 pp.
Bartlow, N. M., S. Miyazaki, A. M. Bradley, and P. Segall (2011). Space-time correlation of slip and tremor during the 2009 Cascadia slow slip event. Geophys. Res. Lett., doi:10.1029/2011GL048714.
Bird, Peter, 2002, Stress direction history of the western United States and Mexico since 85 Ma: Tectonics, Volume 21, Issue 3, pages 5-1–5-12, June 2002 7 JUN 2002 DOI: 0.1029/2001TC001319
Blakely, R. J., Brian L. Sherrod, Jonathan F. Hughes, Megan L. Anderson, Ray E. Wells, and Craig S. Weaver, 2009, Saddle Mountain fault deformation zone, Olympic Peninsula, Washington: Western boundary of the Seattle uplift: Geosphere, April 2009, v. 5, p. 105-125,
Blakely, R. J., B. L. Sherrod, C. S. Weaver, R. E. Wells, A. C. Rohay, E. A. Barnett, and N. E. Knepprath (2011): Connecting the Yakima fold and thrust belt to active faults in the Puget Lowland, Washington, J. Geophys. Res., 116, B07105, doi:10.1029/2010JB008091
Brandon, Mark, Mary K. Roden-Tice, and John I. Garver, 1998, Late Cenozoic exhumation of the Cascadia accretionary wedge in the Olympic Mountains, northwest Washington State, Geological Society of America Bulletin 110 (8), 985-1009.
Brudzinski, M. R., and Richard M. Allen, 2007, Segmentation in episodic tremor and slip all along Cascadia:Geology 2007, v35, pp. 907-910.
Brudzinski, Michal, Boyarko, D., Holtkamp, S., Stefany, SIT, Allen, R., Audet, P., and Porrit, R., 2009, Episodic tremor and slip compared with seismicity and subduction zone structure: integrating the new kid into the existing framework: 2009 Portland GSA Annual Meeting (18-21 Oct. 2009).
Bucknam, R. C., Hemphill-Haley, Eileen, Leopold, E. B., 1992, Abrupt uplift within the past 1700 years at southern Puget Sound, Washington: Science, 258, 1611-1614.
Calvert A. J., Leiph A. Preston and Amir M. Farahbod, 2011, Nature Geoscience 4, 545-548.
Carver, G. A., Peterson, C. D., Garrison, C. E., and Koehler, R., 1996, Paleotsunami evidence of subduction earthquakes from northern California: (abs) 1996 Abstracts with Programs, Geological Society of American Cordilleran Section Annual Meeting.
Creager, K. C., Wech, A. G., and Houston, H., 2010, Tremor bands sweep Cascadia: Geophysical Res. Letters, v. 37, L08301.
Finn, Carol, 1998, Washington aeromagnetic maps and data: U. S. Geological Survey Open File Report 98-241 (available at http://greenwood.cr.usgs.gov/pub/open-file-reports/ofr-98-241.
Flueh, E. R., Fisher, M. A., Bialas, J., Childs, J. R., Klaeschen, D., Kukowski, N., Parsons, T., Scholl, D. W., ten Brink, U., Trehu, A. M., and Vidal, N., 1998, New seismic images of the Cascadia subduction zone from cruise SO108--ORWELL: Tectonophysics 293, 69-84.
Ghosh, Abhijit, Vidale, J. E., Sweet, J. R., and Creager, K. C., 2009, Tremor patches in Cascadia revealed by seismic array analysis: Journal of Geophysical Res., v. 36, L17316. http://www.agu.org/pubs/crossref/2009/2009GL039080.shtml
Ghosh, Abhijit, VIdale, J. E., Sweet, J. R., Creager, K. C.,, Wech, A. G., Houston, H., and Brodsky, E. E., 2010, Rapid, continuous streaking of tremor in Cascadia: Geochemistry Geophysics Geosystems, V. 11, no. 2 .
Ghosh, A., J. E. Vidale, and K. C. Creager (2012), Tremor asperities in the transition zone control evolution of slow earthquakes, J. Geophys. Res., VOL. 117, B10301, doi:10.1029/2012JB009249, 2012.
Glassley, William, 1974, Geochemistry and tectonics of the Crescent volcanic rocks, Olympic Peninsula, Washington: Geological Society of America Bulletin, 85, 785-794.
Goldfinger, Chris , LaVerne D. Kulm, Robert S. Yeats, Cheryl Hummon, Gary J. Huftile, Alan R. Niem, and Lisa C. McNeill, 1996, Geophysical Monograph 96, Oblique Strike-Slip Faulting of the Cascadia Submarine Forearc: The Daisy Bank Fault Zone off Central Oregon. p. 65-74.
Gomberg, Joan and the Cascadia 2007 and Beyond Working Group, 2010, Slow-slip phenomena in Cascadia from 2007 and beyond: A review: GSA Bulletin, July/August 2010, v. 122, no. 7/8. http://bulletin.geoscienceworld.org/cgi/content/abstract/122/7-8/963
Gomberg, J., K. C. Creager, J. R. Sweet, J. E. Vidale, A. Ghosh, and A. J. Hotovec (2012), Earthquake spectra and near-source attenuation in the Cascadia subduction zone, J. Geophys. Res., 117, B05312, doi:10.1029/2011JB009055 [ PDF ]
Ide, Satoshi, 2010, Striations, duration, migration and tidal response in deep tremor: Nature 466, 356–359 (15 July 2010) doi:10.1038/nature09251.
James D.E., Fouch M.J., Carlson R.W., Roth J.B., 2011, Slab fragmentation, edge flow and the origin of the Yellowstone hotspot track: Earth and Planetary Science Letters, v. 311, p. 124–135, doi:10.1016
Karlin, R. E. and Abella, S. E. B., 1992, Paleoearthquakes in the Puget Sound region recorded in sediments from Lake Washington, U.S.A.: Science, 258, 1617-1620.
Komar, P.D., Allan, J.C., and Ruggiero, P., 2011. Sea level variations along the US Pacific Northwest coast: tectonic and climate controls, Journal of Coastal Research, (27) 5, 808-823, DOI:10.2112/JCOASTRES-D-10-00116.1.
Lamb, A. P., L.M. Liberty, R.J. Blakely, T.L. Pratt, B.L. Sherrod and K. van Wijk, 2012: Western limits of the Seattle fault zone and its interaction with the Olympic Peninsula, Washington, Geosphere 2012;8;915-930
Liu, Lijun and Dave R. Stegman, 2012, Origin of Columbia River flood basalt controlled by propagating rupture of the Farallon slab: Nature 482, 386–389.
Logan, R. L., Schuster, R. L., Pringle, P. T., Walsh, T. J., and Palmer, S. P., 1998, Radiocarbon ages of probable coseismic features from the Olympic Peninsula and Lake Sammamish, Washington: Washington Geology, 26, 59-67.
Mazzotti , Stephanie, Herb Dragert , Roy D. Hyndman, and M. Meghan Miller, Joseph A. Henton, Deformation in a region of high crustal seismicity N. Cascadia forearc: Earth and Planetary Science Letters 198 (2002), pp. 41-48.
McCaffrey, Robert, Maureen D. Long, Chris Goldfinger, Peter C. Zwick, John L. Nabelek, Cheryl K. Johnson, and Curt Smith, 2000, Rotation and plate locking at the southern Cascadia subduction zone: GEOPHYSICAL RESEARCH LETTERS, VOL. 27, NO. 19, PAGES 3117-3120.
McCausland, W., and Roeloffs, E., 2007, Detection of Slow Slip Events Along the Cascadia Subduction Zone Using Plate Boundary Observatory Borehole Strainmeters: American Geophysical Union, Fall Meeting 2007, abstract #T21A-0365.
McCrory, P.A., Pollitz, F.F., and Blair, J.L., 2003, Evidence for a tear in the Juan de Fuca plate in the vicinity of the 2001 Nisqually earthquake [abs.]: Geological Society of America Abstracts with Programs, Annual Meeting, Seattle, v. 35, n. 6, p. 309.
Meyers, R. A., Smith, D. G., Jol, H. M., and Peterson, C. D., 1996, Evidence for eight great earthquake-subsidence events detected with ground-penetrating radar, Willapa barrier, Washington: Geology, 24, 99-102.
Mitchell, C. E., Vincent, Paul, Weldon, R. J., II, and Richards, M. A., 1994, Present-day vertical deformation of the Cascadia margin, Pacific Northwest, United States: Journal of Geophysical Research, 99, B6, 12,257-12,277.
Nelson, Alan R., Harvey M. Kelsey, and Robert C. Witter, 2006, Great earthquakes of variable magnitude at the Cascadia subduction zone: Quaternary Research 65 (2006) 354–365.
Plafker, George, 1969, Tectonics of the March 27, 1964 Alaska earthquake: U. S. Geological Survey Professional Paper 543-I, 174 p.
Pratt, Thomas L., Samuel Johnson, Christopher Potter, William Stephenson, and Carol Finn, 1997, Seismic reflection images beneath Puget Sound, western Washington State: The Puget Lowland thrust sheet hypothesis, Journal of Geophysical Research: Solid Earth (1978–2012) Volume 102, Issue B12,pages 27469–27489, 10 December 1997
Raisz, Erwin (1945), "The Olympic-Wallowa Lineament", American Journal of Science, 243-A (Daly Volume): 479–485.
Ramachandran, K., R. D. Hyndman, and T. M. Brocher (2006), Regional P wave velocity structure of the Northern Cascadia Subduction Zone, J. Geophys. Res., 111, B12301, doi:10.1029/2005JB004108.
Rubenstein, Justin L., Mario La Rocca, John E. Vidale, Kenneth C. Creager, and Aaron G. Wech, 2008,
Tidal Modulation of Nonvolcanic Tremor, Science 11 January 2008: Vol. 319 no. 5860 pp. 186-189
DOI: 10.1126/science.1150558
Satake, Kenji, Shimazaki, Kunihiko, Yoshinobu, Tsuji, and Ueda, Kazue, 1996, Time and size of a giant earthquake in Cascadia inferred from Japanese tsunami records of January 1700: Nature, 379, 246-249.
Savage, J. C., Lisowski, M., and Prescott, W. H., 1991, Strain accumulation in western Washington: Journal of Geophysical Research, 96, B9, 14,493-14,507.
Schmidt , D. A. and H. Gao (2010), Source parameters and time-dependent slip distributions of slow slip events on the Cascadia subduction zone from 1998 to 2008, J. Geophys. Res., 115, B00A18, doi:10.1029/2008JB006045
Sherrod, Brian L., Richard J. Blakely, Craig S. Weaver, Harvey M. Kelsey, Elizabeth Barnett, Lee Liberty, Karen L. Meagher, and Kristin Pape, 2008, Finding concealed active faults: Extending the southern Whidbey Island
fault across the Puget Lowland, Washington: Journal of Geophysical Research: Solid Earth (1978–2012), Volume 113, Issue B5, May 2008.
Sherrod, Brian L. and Joan Gomberg, 2013, Crustal Earthquake Triggering by Pre-Historic Great Earthquakes on Subduction Zone Thrusts: in press.
Stanley, W. D., Villasenor, Antonio, and Benz, Harley, 1999, U. S. Geological Survey Open File Rept. 99-311. http://pubs.usgs.gov/of/1999/ofr-99-0311/
Stanley, Dal and Villasenor, Antonio, Models of downdip frictional coupling for the Cascadia megathrust, 2000, Geophysical Res. Letters, v. 27, no. 10, p. 1551-1554, May 15, 2000. http://www.agu.org/pubs/crossref/2000/1999GL005441.shtml
Tabor, R. W.; Cady, W. M., 1978, Geologic map of the Olympic Peninsula, USGS IMAP: 994.
Thomas, Trevor W., John E. Vidale, Heidi Houston, Kenneth C. Creager, Justin R. Sweet, and Abhijit Ghosh, 2013, Evidence for tidal triggering of high-amplitude rapid tremor reversals and tremor streaks in northern Cascadia, Geophysical Res. Let., v. 40, 1-6.
Wech, A.G. (2010). Interactive Tremor Monitoring. Seismological Research Letters, 81(4), 664-669.
Wech, A.G., Creager, K.C., Houston, H., & Vidale, J.E. (2010). An earthquake-like magnitude-frequency distribution of tectonic tremor in northern Cascadia. Geophysical Research Letters, 37, L22310.
Wech, A.G., & Creager, K.C. (2011). A continuum of stress, strength and slip in the Cascadia subduction zone. Nature Geoscience, 4, 624-628.
Wech, Aaron G. and Bartlow, Noel M., 2014, Slip rate and tremor genesis in Cascadia: Geophysical Research Letters, 41: 392 - 398.
Wells, R. E., C. S. Weaver, and R. J. Blakely, 1998, Fore-arc migration in Cascadia and its neotectonic significance: P. 762 GEOLOGY. http://geomaps.wr.usgs.gov/pacnw/pdf/WellsGSA98.pdf
Wilson, D. S., 1993, Confidence intervals for motion and deformation of the Juan de Fuca plate: Journal of Geophysical Research, 98, No. B9, 16,053-16,071.
Vidale, J. E., Hotovec, A. J., Ghosh, A., Creager, K. C., and Gomberg, J., 2011, Tiny intraplate earthquakes triggered by nearby episodic tremor and slip in Cascadia: Geochemistry Geophysics Geosystems, AGU, v. 12, no. 6, 15 June 2011.
LIST OF INFORMAL RESEARCH WEB SITES
Western Washington Tectonics and Faults
http://pugetlowlandseismicity.weebly.com
2014 Oso, Wa Landslide
http://ososlide.weebly.com
brawleyquakes
http://brawleyquakes.weebly.com
cascadiageophysics
http://www.cascadiageophysics.com
imishmashStHelens
http://imishmashsthelens.weebly.com
Tectonic Background for Washington State Earthquakes
http://tremorandtectonicswashington.weebly.com